So ever since Jerome 'Big Mouth' Powell did a 'Clubber Lang' on the markets, you can see that it's been down for 5 days in a row, and it's a hair away from the 17th June low.
So the market's way oversold right now, and when markets are way oversold there's a very high chance we're gonna have a rally snapback.
We're coming towards the last 3 months of the year when the market tends to rally. So like I said, there's a high chance we may retest that low and then rally from there. . . but what if we break that low and we don't rally?
What if we break that low and we keep going down?
So how much lower could it go?
Table Of Contents
Global Recession Probability Model
Global Recession Probability Model
Before that, I got even more bad news;
It seems that we are right now in a severe Global recession according to Ned Davis Research.
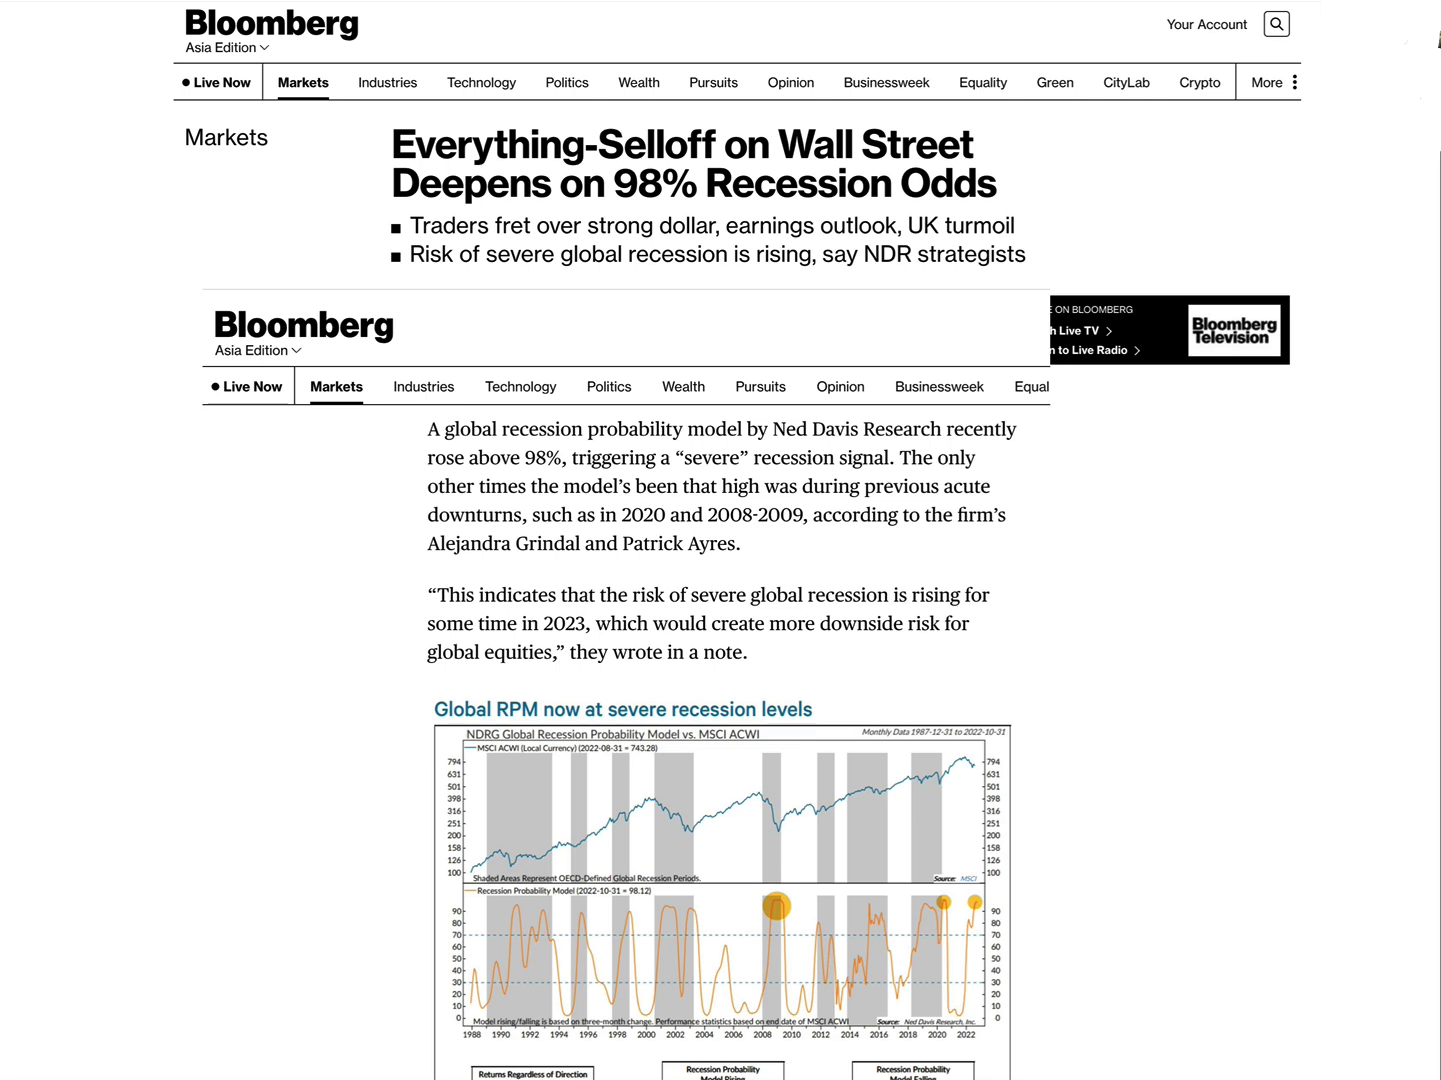
This article came out on Bloomberg on 27 September. It says everything is collapsing because there's a 98% chance of a global recession happening right now.
It says "A global recession probability model by Ned Davis Research recently rose above 98%, triggering a severe recession signal the only other time the model has been this high was during the previous acute downturns like 2020 and 2008-2009 Global Financial Crisis."
That sounds really scary.
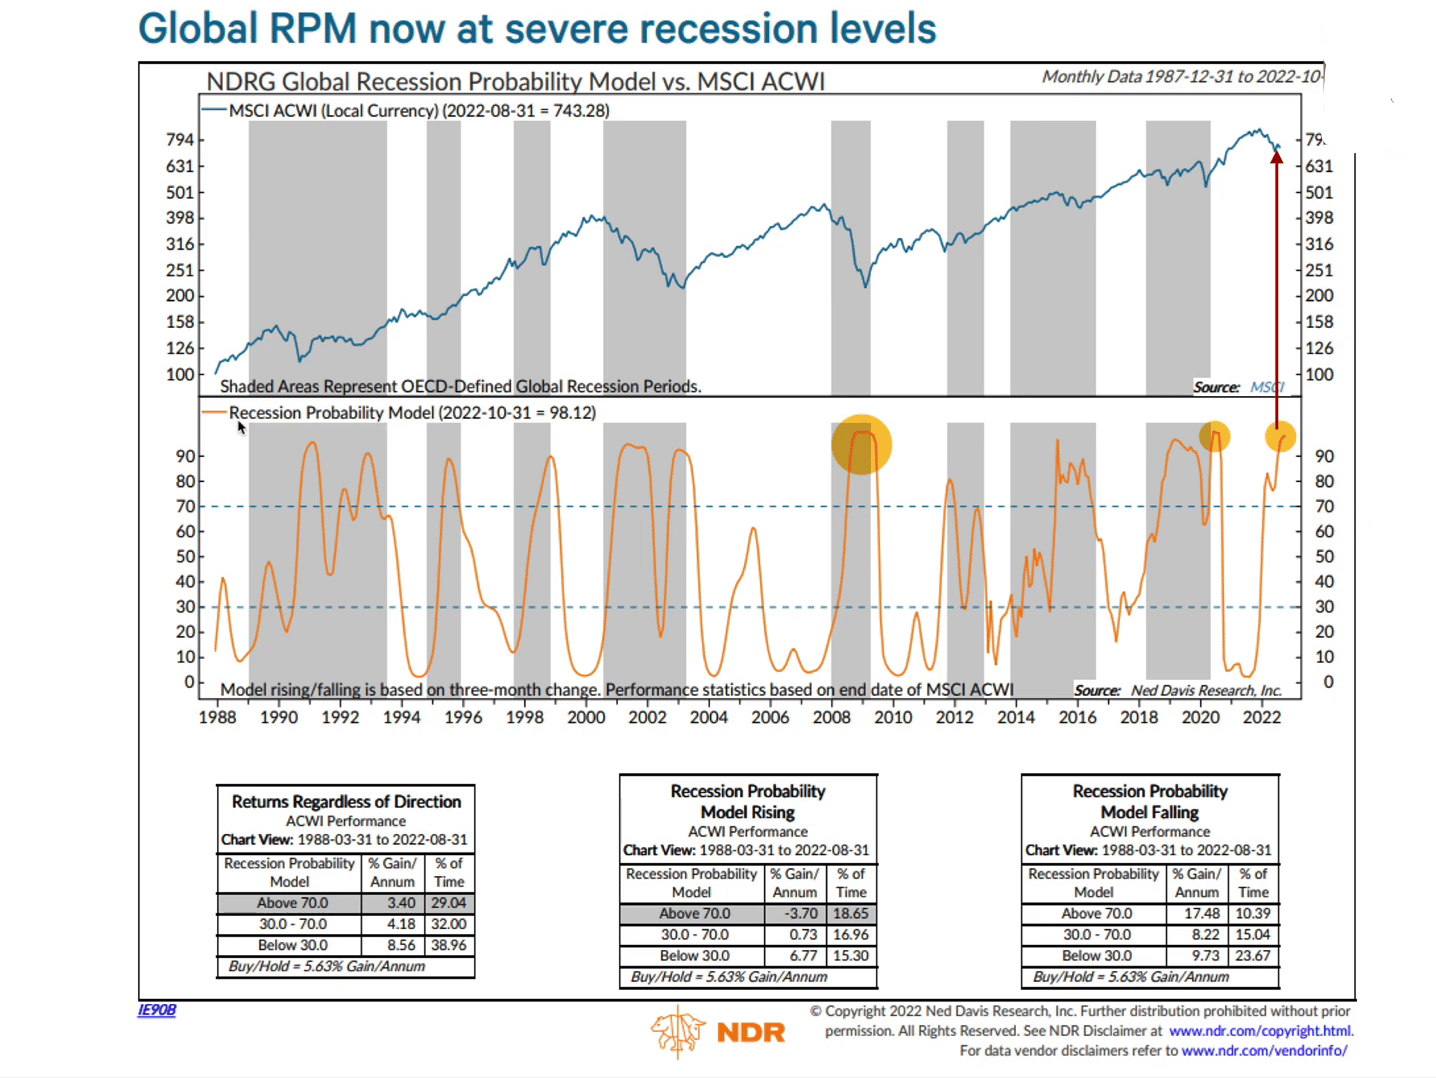
So here we are so right now September 2022. This recession probability model has hit 98%. So what does it mean?
Does it mean that we should panic and sell everything because we're gonna go to hell? Or is it a time that the market may actually bottom?
So let's take a look at previous times when this model hit 98%. It happened twice since 1988 it happened in 2020, it happened during the Great Financial Crisis.
When this model meets that exact same signal, where was the stock market?
The stock market was at the bottom — in fact at the early stages of the new bull market!
How can this be? Why is it that when this model tells us that it's a recession, the stock market has actually bottomed and is near the bottom and it's going up?
Remember that all these models are lagging indicators. By the time they tell you it's a recession, it's already in a recession in fact it's during the middle of the recession or towards the tail end of it.
Other times when it went above a 70% probability, by the time this signal came in, the economy was already in the middle of a recession towards the end of it. The gray shaded area represents the recessionary periods.
Now some of you may be wondering "Hey this shaded area represents recession so how come we are not yet in a recession
based on this chart? Why is there not a gray line over here?"
Well, that's because the NBER, the National Bureau of Economic Research has not officially declared a recession. Once they declare it they'll say okay it started on this date then they would have this shaded graph. Here's the problem; historically by the time the NBER declares a recession, it is usually 7.8 months after the recession began!
In other words, it's only after the recession started, 7.8 months later when it's going to end do they say "Hey, we were actually in a recession!"
So it's always a lagging indicator. I'm not saying that right now is the bottom — I can't predict for certainty we could still go lower. What I'm saying is to be careful when you read articles like that. A lot of people read these articles and they get really emotional, they get terrified, and they sell because they think that we're gonna go into a global recession.
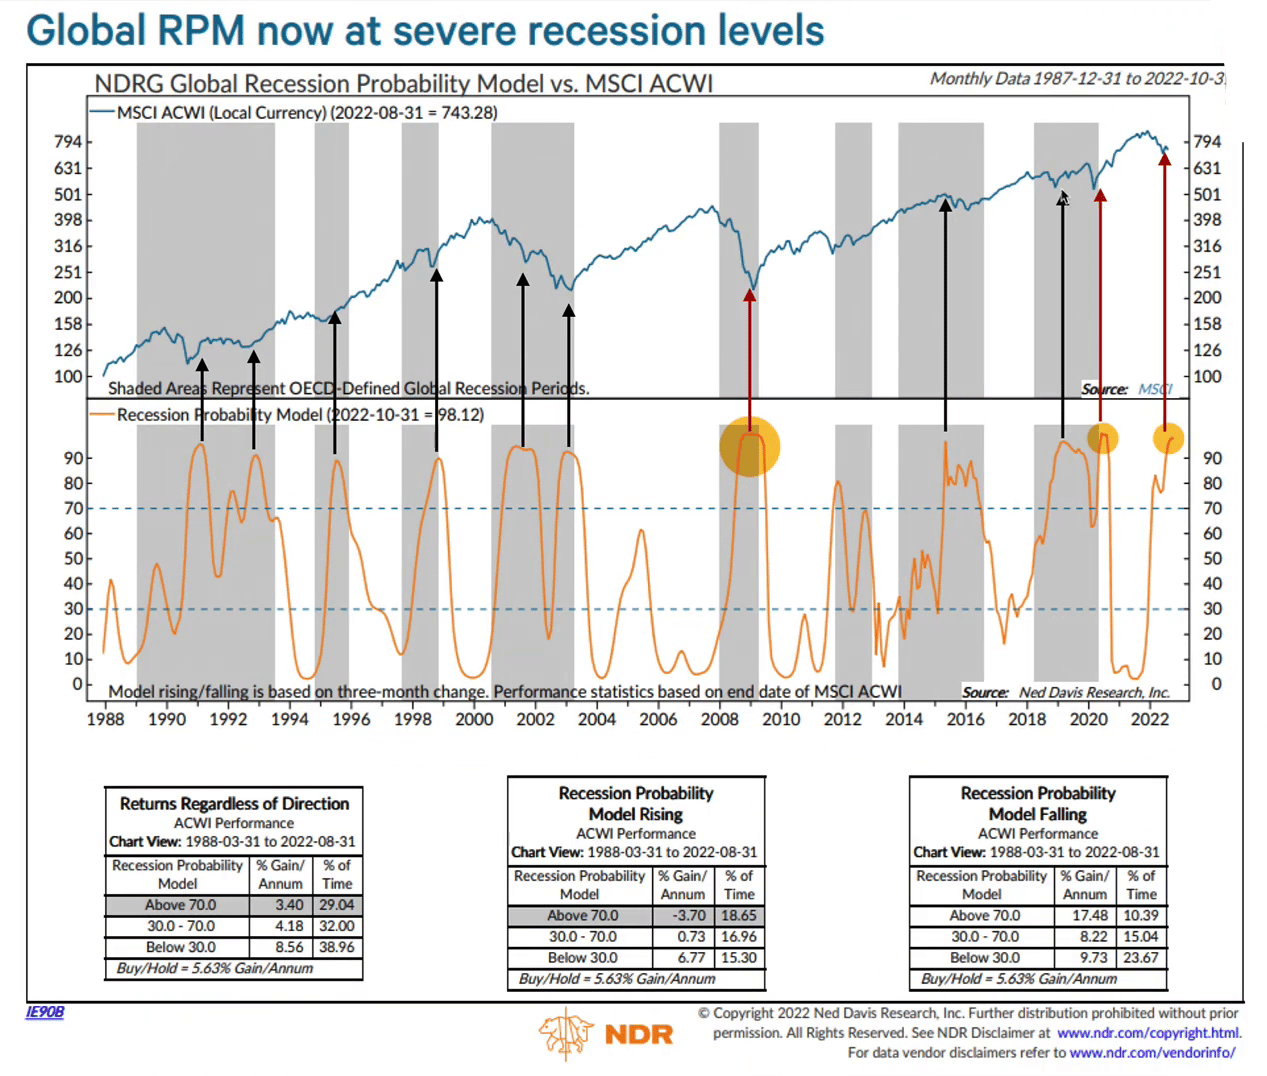
Historically if you had sold every time the market went above 70% recession, you would have sold near the bottom of the market.
So you can see that historically, when there's a global recession signal, more often than not the market is very near or at the bottom! Not all the time, but more often than not, so I would much rather be a buyer of stocks right now than a seller of stocks.

Get The Latest stock market analysis & tips every week!
Subscribe to our weekly Newsletter FOR FREE!
*Your email address will not be forwarded to any third party. We respect your privacy.
What's The Potential Downside If The Market Breaks Its Low?
Let's go back to our earlier question; what is the potential downside of the market if it breaks those laws from 17th June — How much lower can it go?
If you listen to the media, you've got people saying that "Hey the market could drop another 50% or 30%!"
Well, everything is possible in the markets, but I think that before you make a decision or before you have a target, you can't just pull it out of nowhere.
You can't just say "I feel it's going to drop down 20%, 30%," you have to base it on numbers, you got to do some research!
What I decided to do was to plug in some numbers to kind of like calculate what's the fair value of the S&P 500. To do that I'm going to use a Discounted Cash Flow Model using this S&P 500 Intrinsic Value Calculator.
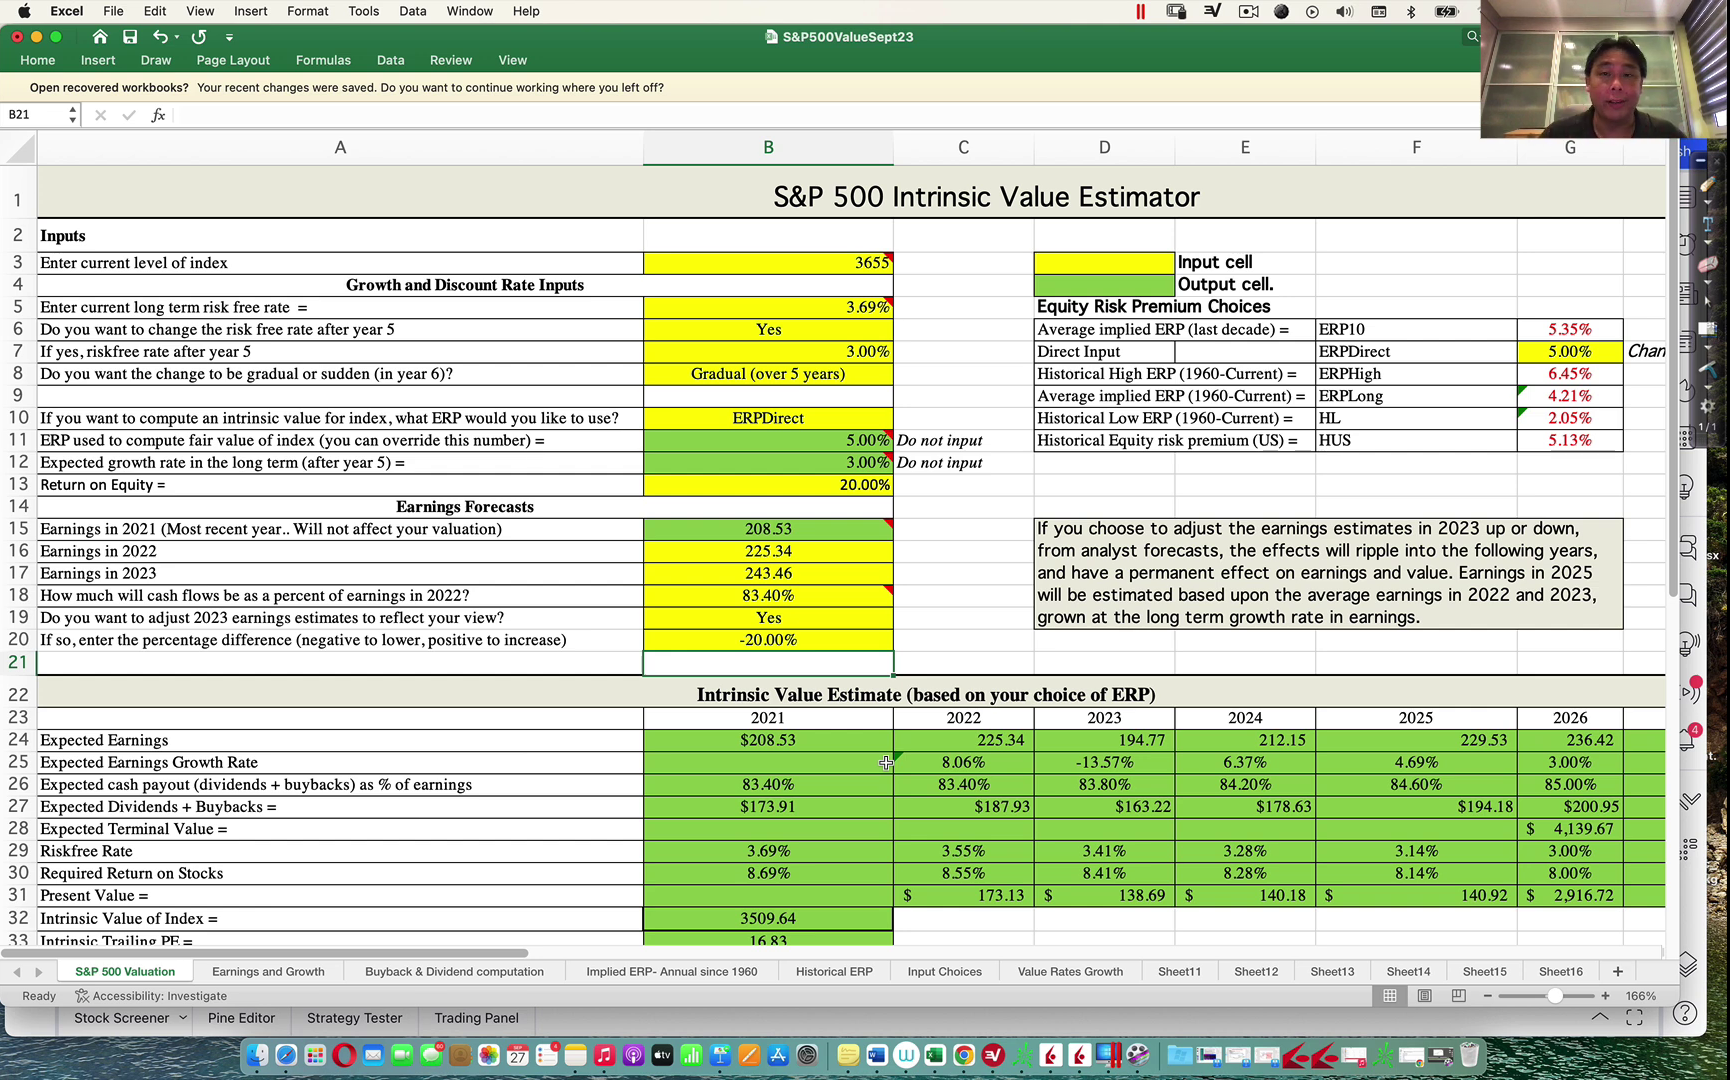
First of all, I did not create this calculator, I'm not that smart. This calculator was created by Professor Aswath Damodaran and he's a professor of Finance at NYU. He created this valuation calculator and kindly shared it.
So what should the S&P 500 be at?
It depends on 2 main things:
#1: It depends on corporate earnings
Remember at the end of the day, it is the earnings of the company that determines the value of the company, so we're going to make some assumptions about corporate earnings.
#2: It depends on the Risk-Free Rate
Also known as a 10-year treasury yield.
Currently, the 10-year treasury yield as of right now is at 3.838%, so let's just use 3.8%, which will be the long-term risk-free rate.
Will the rate remain at 3.8% or higher in the long run?
What drives the 10-year yield is inflation expectations. So when people expect High inflation the 10-year yield goes up as you can see from the chart over here:
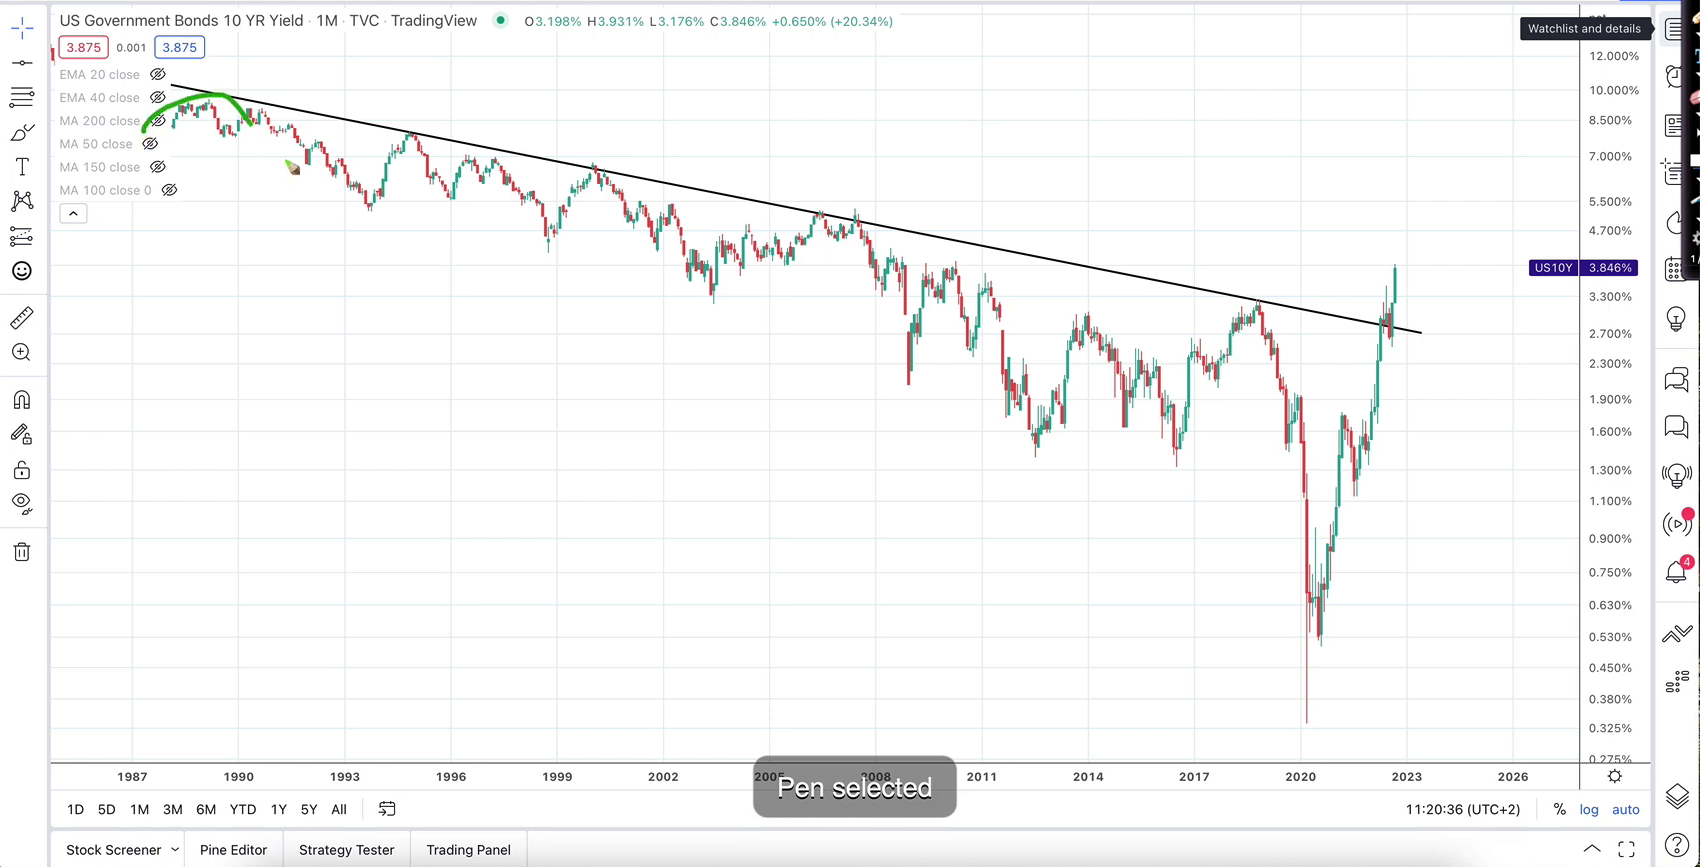
In the long run, you can see that the 10-year yield has actually been going down for the last 40 years, but because now we had crazy inflation that has driven up the yield all the way up to 3.8%. That's what's been causing the stock market to come down.
So the question is will this continue to go up or stay at a very high level? Do I expect a 10-year you to come down?
Different people have their own opinions; my opinion is that the 10-year yield will come down in the next couple of years. It'll come back down to probably 3% or lower.
Few reasons why:
1st reason is that I believe that inflation has really peaked, and inflation is decelerating. One good leading indicator is the 5-year break-even inflation rate.
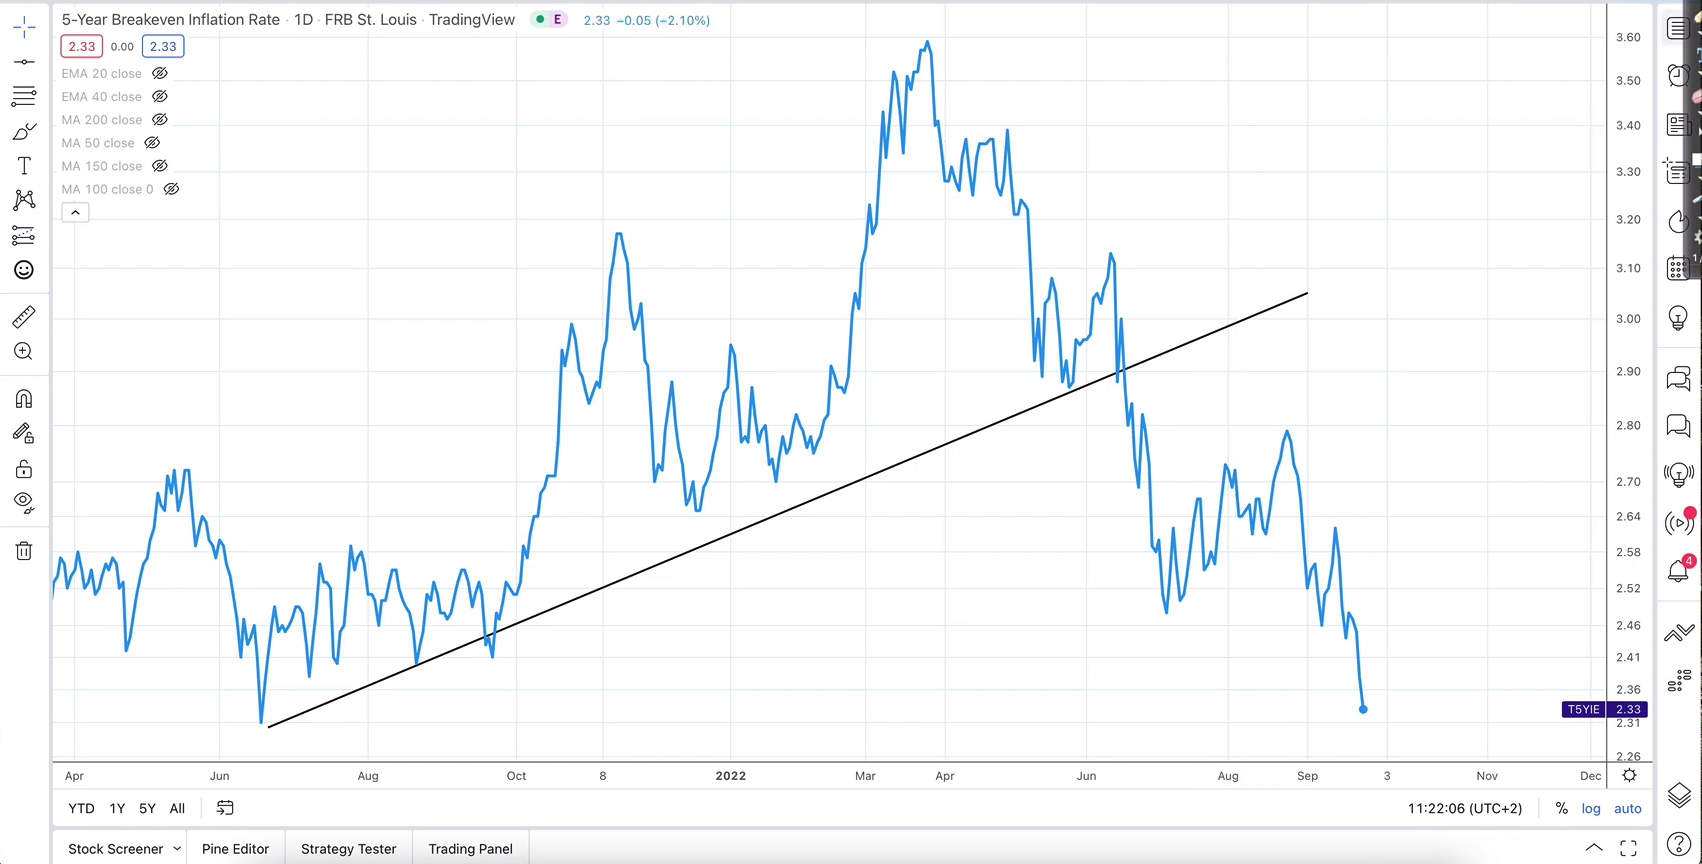
You can see what has happened to the leading indicator of inflation. It peaked and it's gone all the way down to 2.33%. So that means that in the next 5 years, inflation will likely go back down to 2.33%. I believe that, without a doubt. Because of that, I believe that the 10-year yield will eventually come back down. That's the 1st reason.
2nd reason is this; remember that the Federal Reserve, the US government, will not allow the yield to remain high for too long.
Think about it, if the yield is say at 4% that means if the U.S government borrows money by selling bonds, they have to pay an interest rate of 4%. How long can they do that before they'll go broke?
So the government wants the yield to be as slow as possible so they can lend money and pay less interest so it's not in the government's interest to keep yields high. They want to get yields back down once inflation moderates.
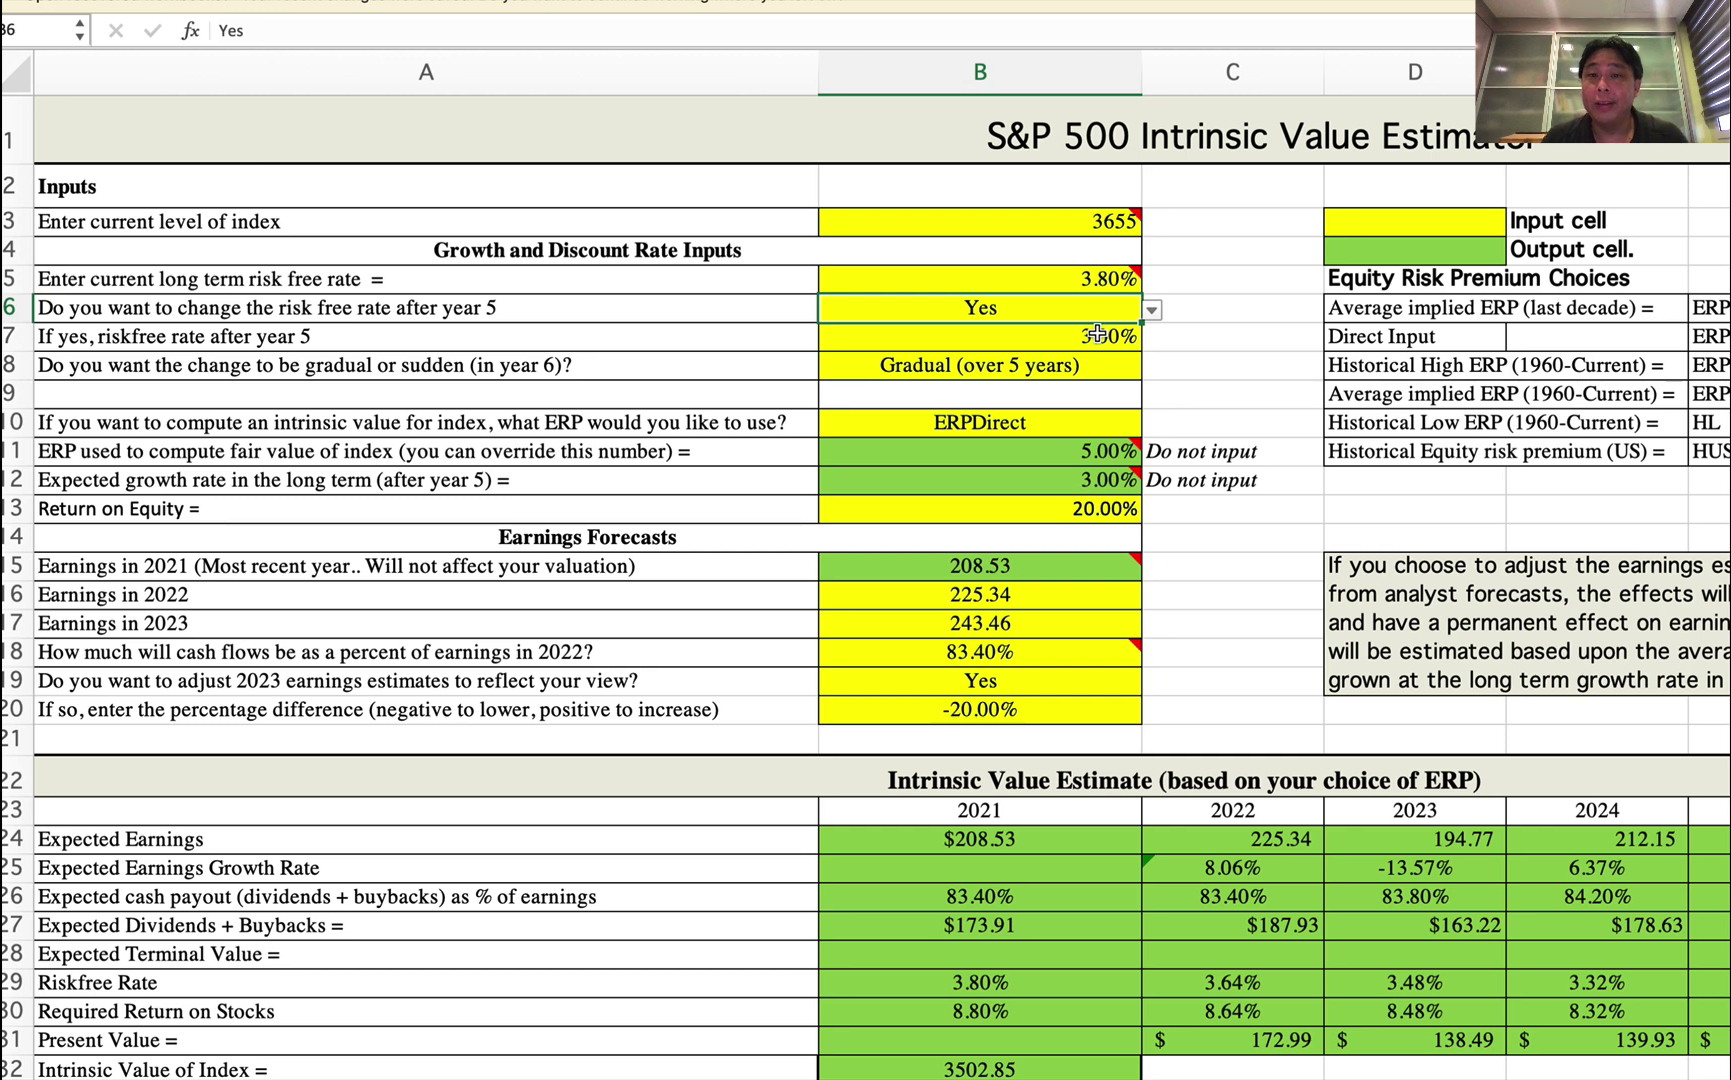
So because of that, my assumption in this model is to say yes, the risk-free rate after year 5 will drop back to 3%. I think it's going to happen before year 5, but based on this model it's at least 5 years, I'm gonna put it at 3%. That's my assumption.
Next in this model, what we have to do is we have to project what are the earnings per share of the S&P 500. So these are the expected earnings:
All this has come from the analyst consensus estimates which you can get at Yardeni Research.
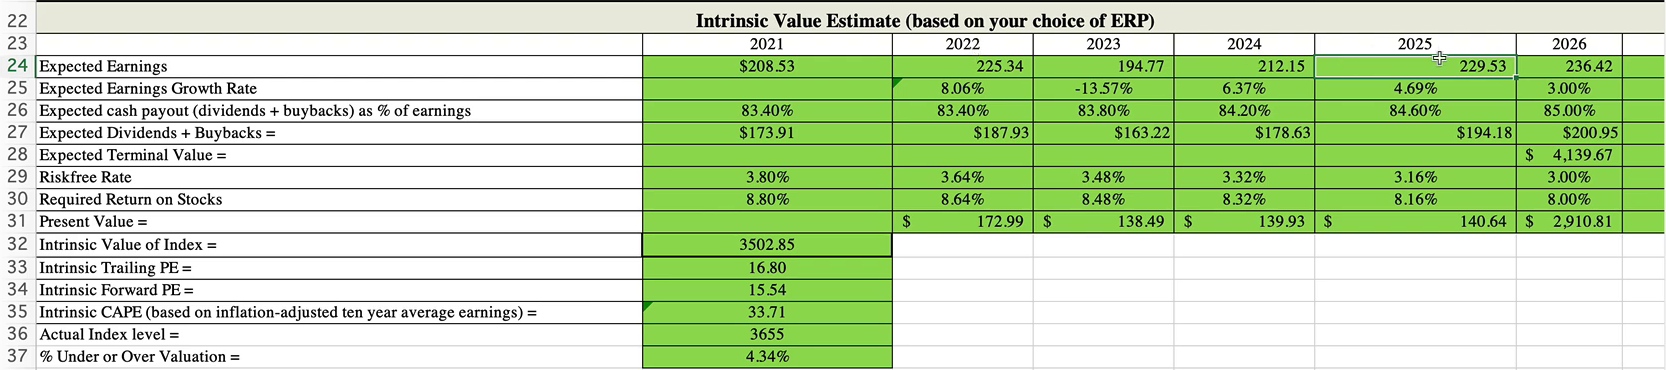
If you plug in $225 earnings per share for 2022 and $243 earnings per share in 2023, plug that into the formula, assuming 6% growth in 2024, 4% growth in 2025, 3% growth in 2026, and you calculate using a terminal value, you get an intrinsic value of 4121.
So assuming that corporate earnings meet analyst expectations the S&P 500s fair value is at 4121.
So currently S&P 500 is at 3655. If the companies can meet analyst expectations, then the S&P 500 should be at
$4121.
So this implies an upside of about 13% above current levels. Most of the time, do companies meet expectations, beat expectations, or do they disappoint below expectations?
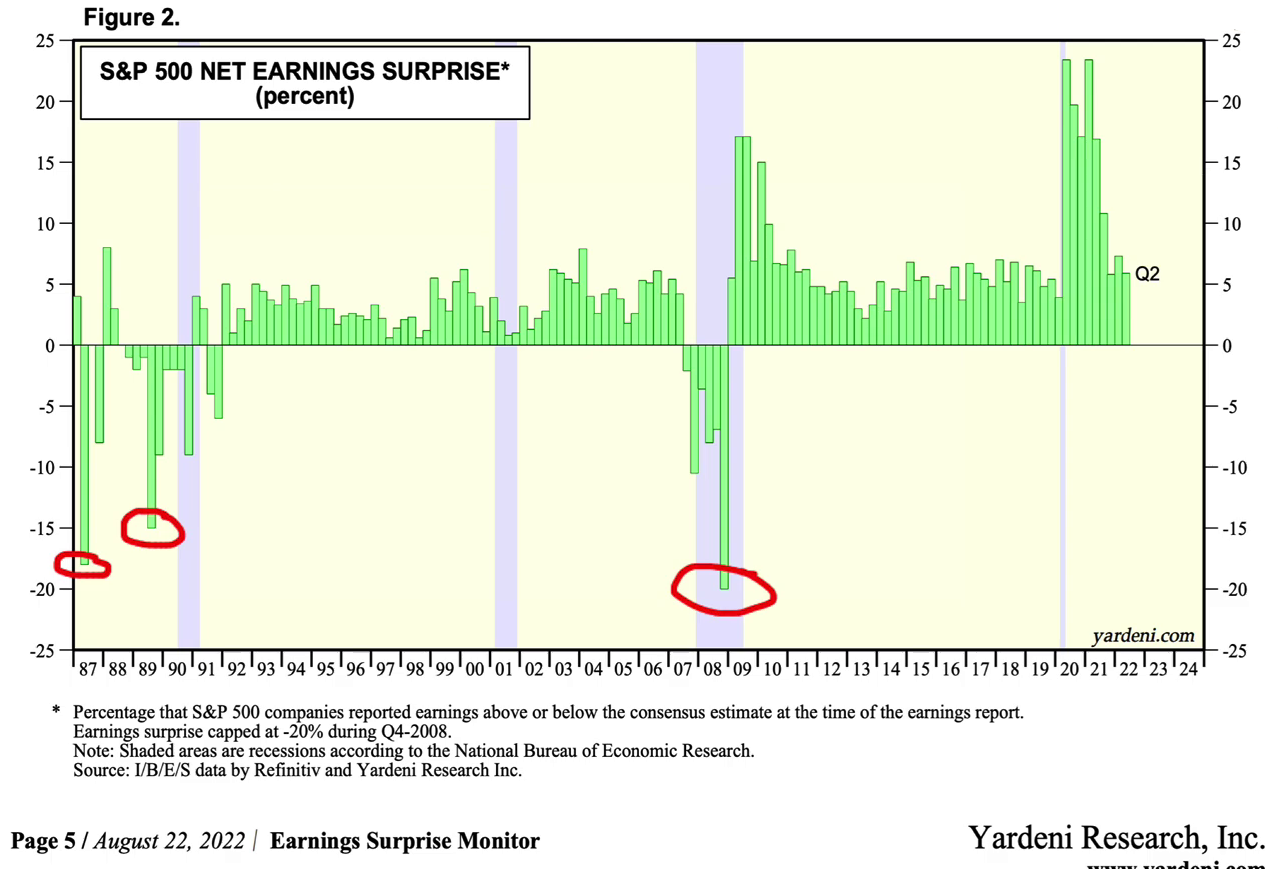
This goes back to 1987. You can see that most of the time during the earnings season, companies will report earnings above expectations. Anything above the 0-line would be what we call an earning surprise.
For example, in the last quarter, quarter 2, companies announced earnings 5% above expectations and during 2021 they were 15%-20% above expectations. So most of the time, companies announce earnings above expectations, but we're assuming that they're just gonna meet expectations at 0.
Let's take a look at the pessimistic scenario — what if companies miss expectations because of this earnings contraction, and this severe recession that we are supposed to be in? Well, let's see how bad it was.
You can see that back in the last recession back in 1990, recession companies missed expectations by 15%.
So we're going to calculate what happens if we get a 15% miss.
During the Global Financial Crisis, companies miss expectations by 20%, so that is our downside. A 15% to a 20% miss. Let's put in the numbers and let's see what we get.
We are going to adjust our earnings estimates to reflect our view. We're going to put in the percentage difference, we're going to put in a 15% miss on earnings.

If you put a 15% miss on earnings the S&P valuation goes down to 3606. So that's the downside!
Now what if it's really bad like the worst-case scenario — Global Financial Crisis — it comes in 20% below expectations? How screwed are we at that time? Let's put that number into the model.
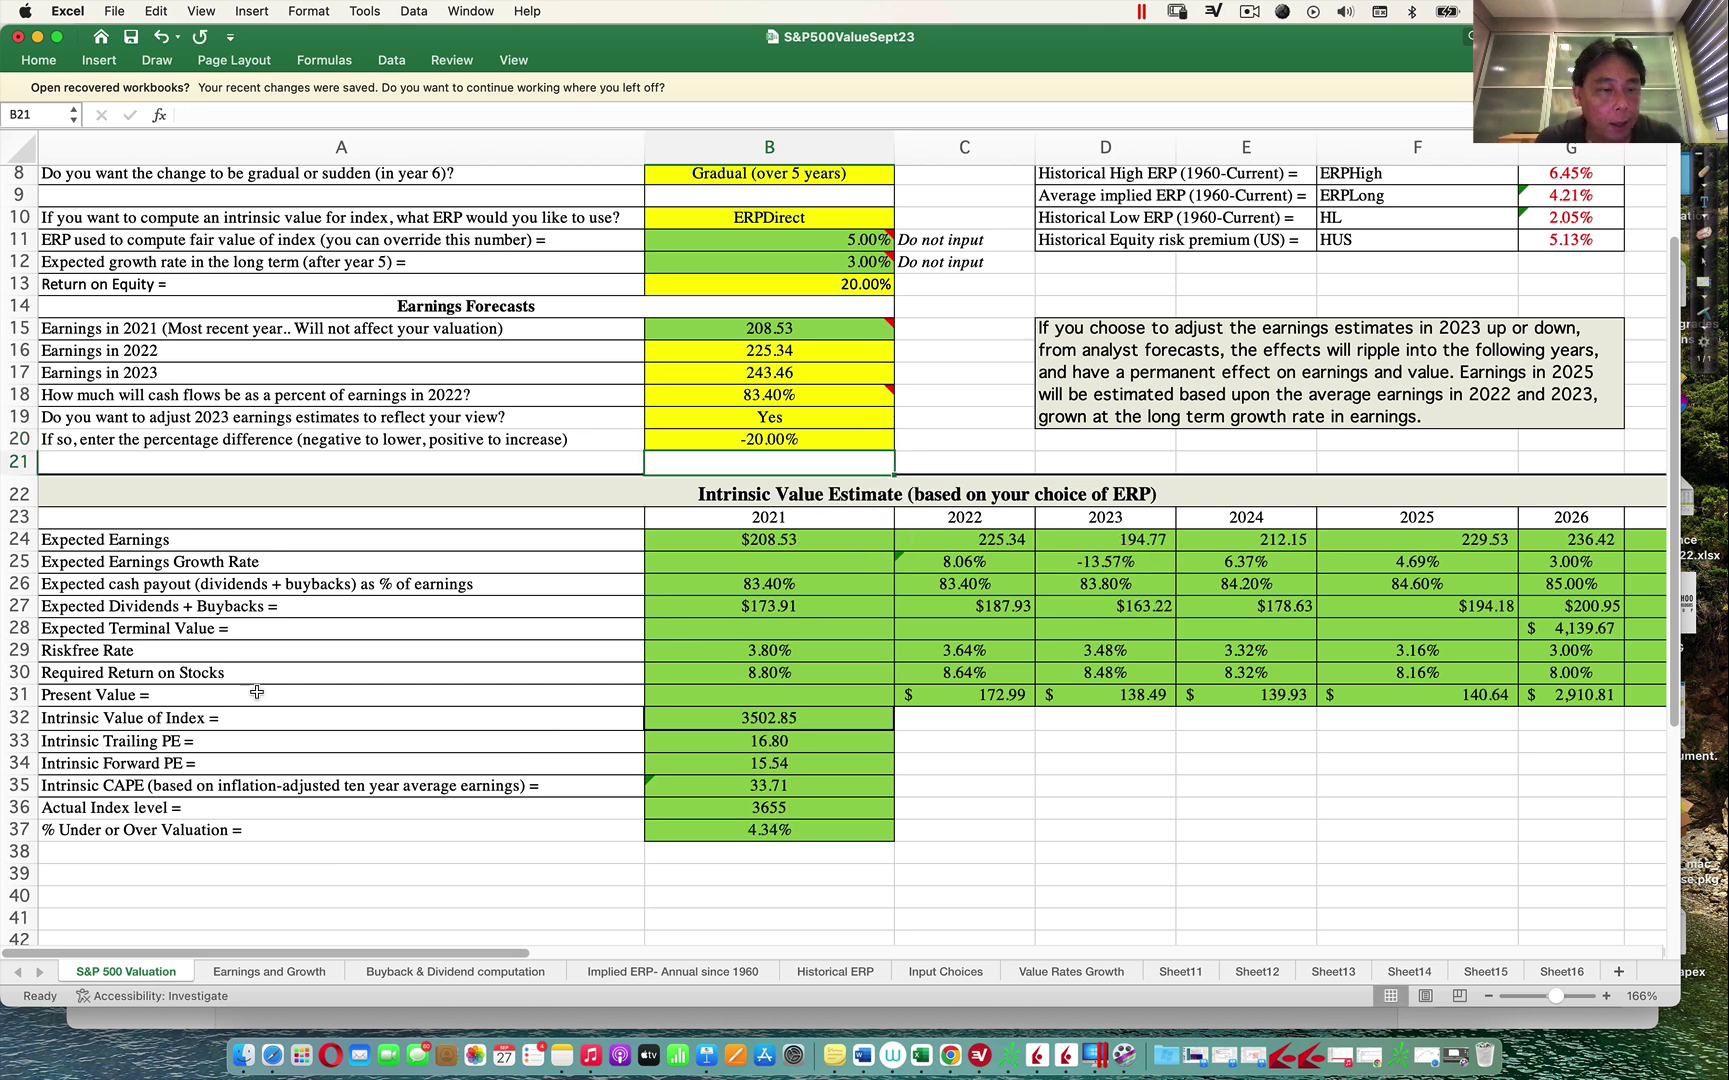
The intrinsic value of the index goes down to 3502.
In other words, if companies deliver really bad earnings 15% below expectations then the S&P from the current level should theoretically be at 3606, roughly a 1.3% downside. If we get a 20% miss, then the S&P 500 should drop by about 4.1% to 3502 points.
How It Looks Like On The Charts
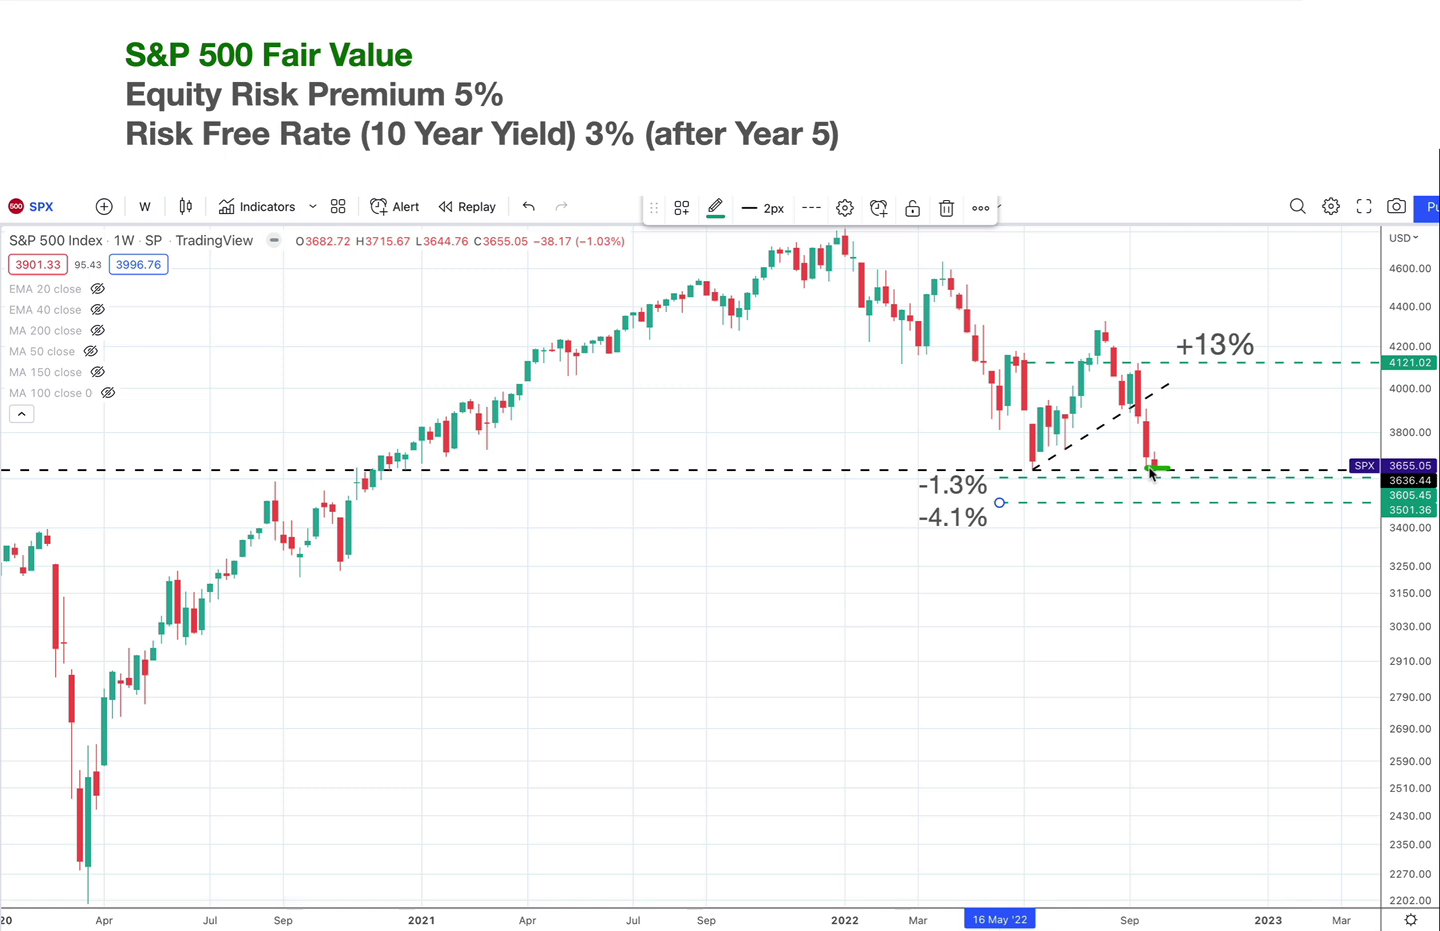
Currently, we are at 3655. It all depends on corporate earnings.
If companies can meet expectations then we should be up 13% upside from current levels.
But if companies miss expectations by 15% then the market theoretically should be at the 3636 level, which is a 1% downside from current levels.
If companies miss earnings by 20% — which happened during the Global Financial Crisis — how low should we go? Down to 3501, a 4.1% downside.
In other words, what I'm saying is that if you take a look at the market, it's already dropped so much that even if companies miss expectations by 20%, there's not much downside left. There's a lot more upside potential than downside risk at this stage.
If you take a look at history, companies tend to beat expectations more often than not. You can see that you know going back all the way to 1987, companies tend to beat Expectations by at least 5% or even 10% at times. For it to miss expectations, it happens very rarely, only during severe recessions which again could be the case this time.
So if companies can beat expectations by 5% to 10%, that's how we can get back to previous highs and beyond! Of course, eventually, we will get there. The only question is how soon will it be — Next year or the year after, or the year after it.
We will get there again, it's only a question of how soon.
Now here's the other good news even if companies miss expectations and the index drops, does it mean that all your stocks will drop? Does it mean that all sectors will drop?
NO!
For example, during the financial crisis, it was mainly the financial stocks that went down — the banks — whereas the consumer staple stocks & healthcare stocks actually went up. And back during the Dot-com crash, it was the technology stocks that missed earnings whereas the energy & financial stocks went up.
So it all depends on the kind of companies you hold. That's why it's really important for an investor to hold a diversified portfolio of different kinds of companies. For me, I've got technology companies, I've got Healthcare, I've got Finance, I've got all kinds of companies because I know that not all companies will have their earnings contract.
If you hold great companies with earnings and pricing power, they can maintain their profit margins, and most of my companies are in that category.
The bottom line is that a lot of people are fearful that company earnings will contract, corporate earnings will miss expectations, and the Market will collapse.
So I'm here to tell you that even if that happens — even if corporate earnings miss by 20%, the S&P 500 fair value should be at 3501 which is only a 4% downside from current levels now.
I promised to show you the worst-case scenario which is "What if the risk-free rate doesn't drop, inflation remains high, and the 10-year yield continues to stay above 4%"
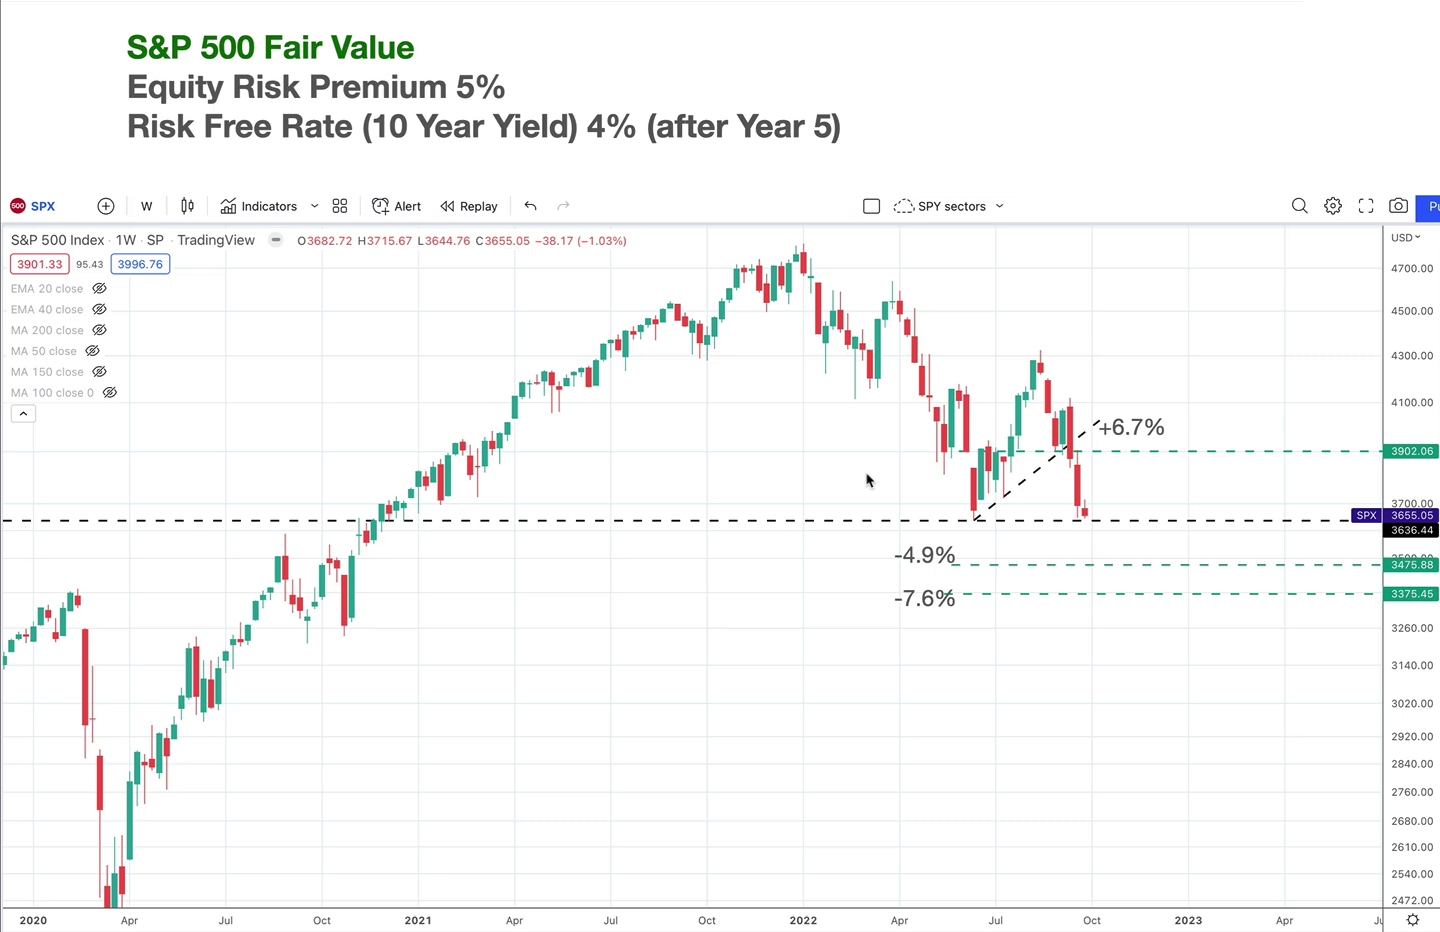
Now in that scenario, valuations will go down as well and you can see that if earnings contract by 20% below expectations we could see a 7% downside at current levels, and that is the absolute worst-case scenario.
But the good case scenario is that if it meets expectations, you'll have a 6.7% upside to 3009, and if it beats expectations which it normally does, then we could have a lot more upsides back to previous highs and higher highs.
People always talk about the risk of staying in the markets, that if I stay in it's risky because prices could go lower. But what I find even riskier is staying out of the markets!
Now if you stay in the market, sure, there is a chance that prices could go lower in the short term. But if you hold on to fundamentally good companies that are making more and more money every year, if you hold on to index ETFs, the prices will always go up eventually in the long run. So while it may feel like a psychological loss in the short term if prices go lower, you always win in the end.
Now, people who get out of the markets or stay out of the markets may feel like they are psychologically winning when they see prices going down without them. Eventually, guess what; prices will always rise eventually and chances are they will never get in the markets because in their mind, the next day it'll always get lower so they end up never ever getting in, and if the market suddenly rallies they miss out and the market takes off without them. That's what happens to most people and as prices keep rising, they will ultimately lose out in the end in terms of huge opportunity costs.
So which is better; to have a possible short-term psychological loss if prices go lower for a while but ultimately win, or a short-term psychological win if prices go lower but an ultimate loss of not growing your wealth?
It's up to you, but I think that the second one is a lot riskier and that's why I personally choose to stay in the markets.
But again, as always I tell people only to invest with money that they don't need to use in the short term. If you need to use the money do not invest it. Keep it in cash for your expenses, for emergencies, but if you don't need the money and it's a surplus, invest it but not all at once!
Average in your positions because even if it goes lower you get a chance to add your stake in great companies at lower prices!
If you want to learn how to invest for long-term growth, do check out my > VALUE MOMENTUM INVESTING™ Course <
Get The Latest stock market analysis & tips every week!
Subscribe to our weekly Newsletter FOR FREE!
*Your email address will not be forwarded to any third party. We respect your privacy.


submit your comment