The US 10-year Treasury yield has climbed from around 4.0% to nearly 5.0% over the past twelve months. Every move higher gets treated by the media as a countdown to something breaking.
The number itself isn't the problem. The reference point most people are measuring it against is.
The Fed doesn't set this number
A common assumption is that the Federal Reserve controls interest rates. It doesn't entirely.
The Fed sets the federal funds rate, which is a short-term rate. The 10-year Treasury yield is a long-term rate, and it's determined by the demand and supply of US government bonds in the open market. Bond buyers decide what yield they need to hold a 10-year IOU. The Fed can influence the mood. It doesn't set the level.
This distinction tells us where to look for an explanation. If long rates are rising, the answer isn't in the Fed's dot plot. It's what bond buyers are pricing in for the next decade.
What usually anchors the 10-year yield
There's a rough anchor for long-term rates that's simpler than most commentary suggests:
Inflation + real GDP growth ≈ the 10-year Treasury yield
That's essentially nominal GDP. Bond investors want compensation for the erosion of purchasing power (inflation), plus something close to the underlying growth rate of the economy.
Run the current numbers. In Q2 2026, US real GDP came in around 1.5%. The most recent headline CPI reading was around 3.4%. Add them together and you get 4.9%.
Which is nearly where the 10-year yield is sitting. The yield isn't detached from reality or being driven somewhere irrational. It's tracking the economy's nominal growth rate closely. A 5% handle might not be a market dislocation, it's arithmetic.
Where 5% sits against 76 years of history
Here's the part that usually gets skipped.
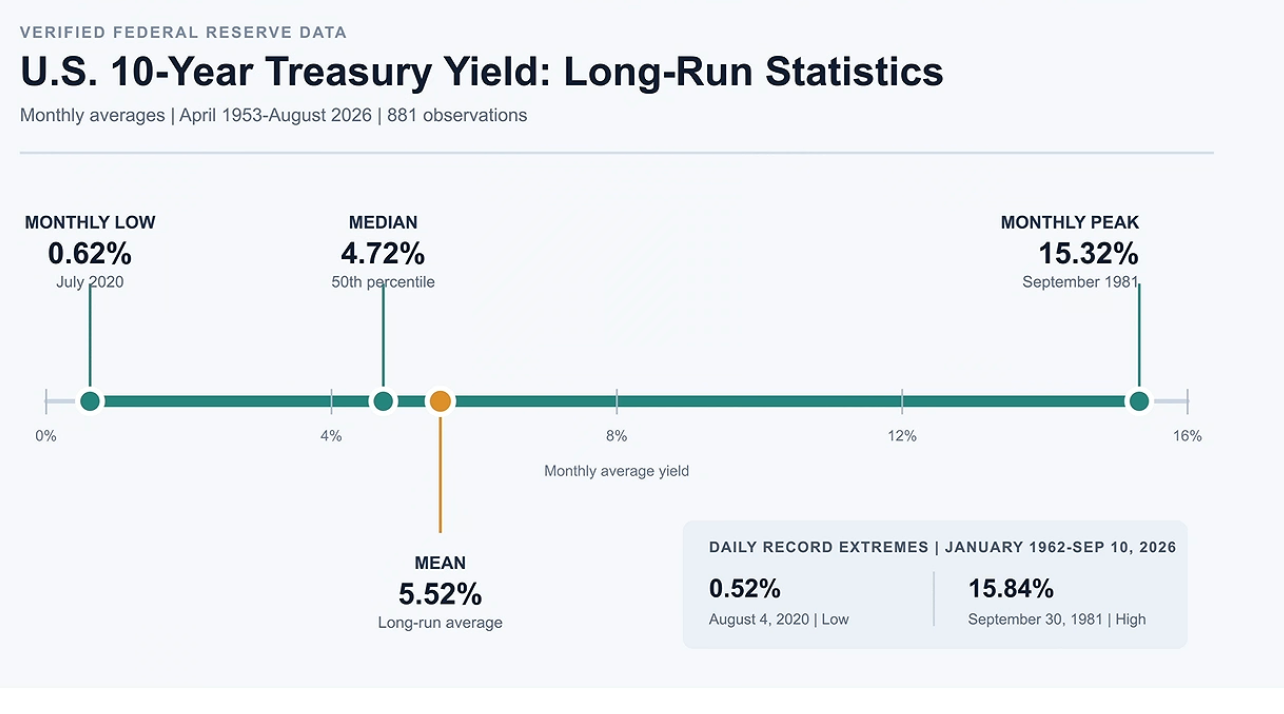
Plot the 10-year Treasury yield from 1950 to today and you get 76 years of range. The extremes:
- Peak: roughly 15.6%, in 1981
- Trough: roughly 0.7%, during COVID in 2020
And the middle:
- Mean (average): about 5.52%
- Median: about 4.72%
A yield approaching 5% is not near the top of that range. It's not near the bottom either. It's sitting just below the long-run average, closer to the middle of seven decades of data than to any historical extreme.
By the standard of the last 76 years, today's 10-year yield is unremarkable.
Why it feels extreme
The reason 5% registers as alarming is that the comparison most people are running is against the last few years, not the last few decades. Long-term rates were near 0.3% not that long ago. Against that anchor, 5% looks like a sixteen-fold increase and a genuine emergency.
But that near-zero period was an anomaly. The lowest reading in seven decades, produced by an extraordinary set of circumstances. Using the most abnormal moment in modern rate history as your baseline for "normal" will make an ordinary number look like a crisis every time.
The reframing: rates aren't unusually high today. They were unusually low then.
What matters more than the level
If the level alone doesn't tell you much, then what does?
Two things.
First, the speed of the move. A yield that drifts from 4% to 5% over a year gives companies, borrowers and markets time to adjust. The same move compressed into six weeks is a different event, because repricing that fast forces liquidation rather than adaptation.
Second.. and more importantly, the reason behind the move. This is where the distinction gets useful:
- If yields are rising primarily because of inflation while corporate earnings are flat or declining, that's the genuinely difficult combination. Discount rates go up, the cash flows being discounted don't, and valuations compress with nothing offsetting them.
- If yields are rising while corporate earnings are also growing, the picture is different. Rising discount rates and rising earnings can coexist, and historically stocks have gone up during periods when the 10-year yield was also going up.
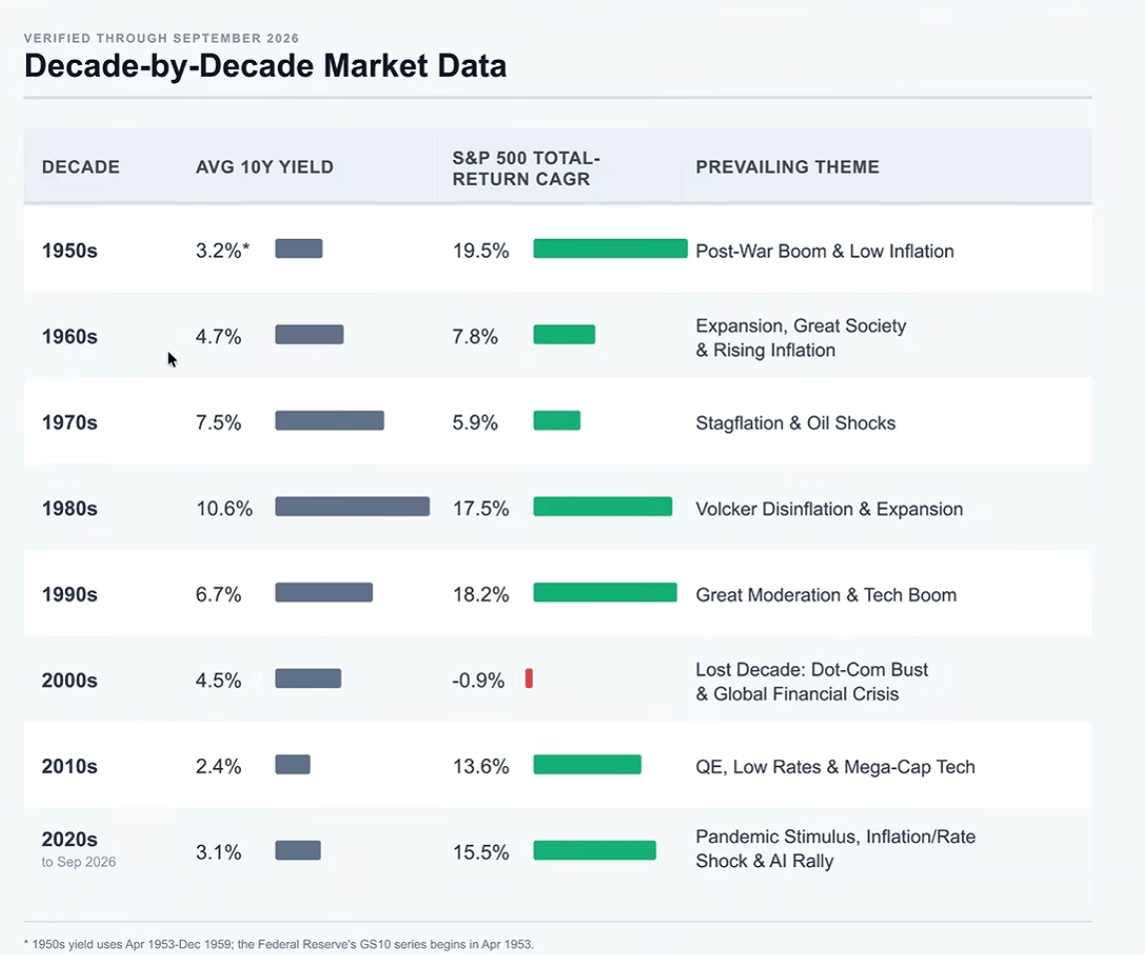
That second scenario is not a theoretical one. Across 76 years there are decades where the average 10-year yield was low and stock returns were exceptional, and decades where it was high and returns were still strong. In the 1950s, the average 10-year yield sat around 3.2% and the S&P 500 compounded at roughly 19% annually. The relationship between "rate level" and "stock returns" is far looser than what the headlines usually imply.
High yields, by themselves, have not historically meant negative market returns.

How to read this going forward
None of this means rising rates are irrelevant. They are not. Higher long-term rates change how future cash flows get valued, they change the cost of capital, and they affect some businesses far more than others.
What it does mean is that "the 10-year hit 5%" is not, on its own, an informative signal.
The more useful questions are the ones underneath it:
- Is the yield roughly consistent with inflation plus real growth, or has it detached from both?
- How quickly did it get here?
- What's driving it.. inflation expectations, growth expectations, or supply and demand in the bond market?
- Are corporate earnings growing alongside it, or stalling?
Those questions produce a picture. Understanding it is most of the work.
This article is for educational purposes only and does not constitute financial advice or a recommendation to buy or sell any security. Past performance and historical data are not indicative of future results. All investing carries risk, including the potential loss of capital. Figures cited reflect data available at the time of writing and are subject to revision.










submit your comment