If you've felt like the market has been more nervous lately, more sudden drops, more V-shaped recoveries, more days where everything seems to unravel and then quietly stitch itself back together. You're not imagining it.
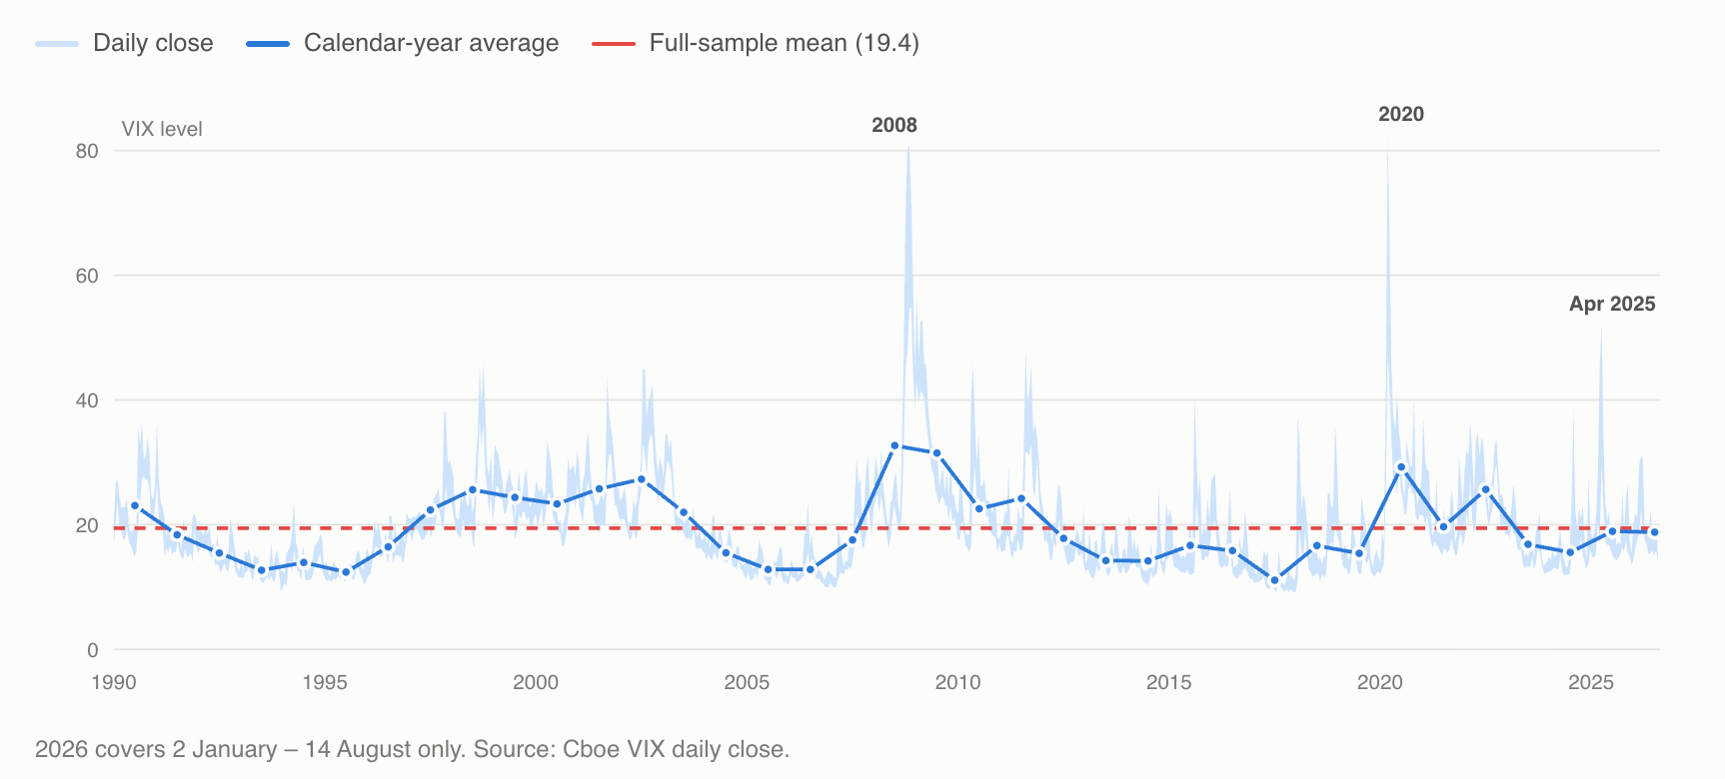
The VIX, the market's fear gauge, doesn't actually agree with the "things are worse now" narrative. We looked through 36 years of data and found that the long-run average across 36 years (1990–2026, more than 9,200 trading days) sits at 19.4. 2025 averaged 18.9.
2026, through mid-August, averaged at 18.8. Slot those numbers into a table of annual averages and nothing looks really unusual at all.
So which is it.. has the market gotten more volatile, or hasn't it? We will uncover it in this article.
What actually changed: not the size of the fear, the length of it
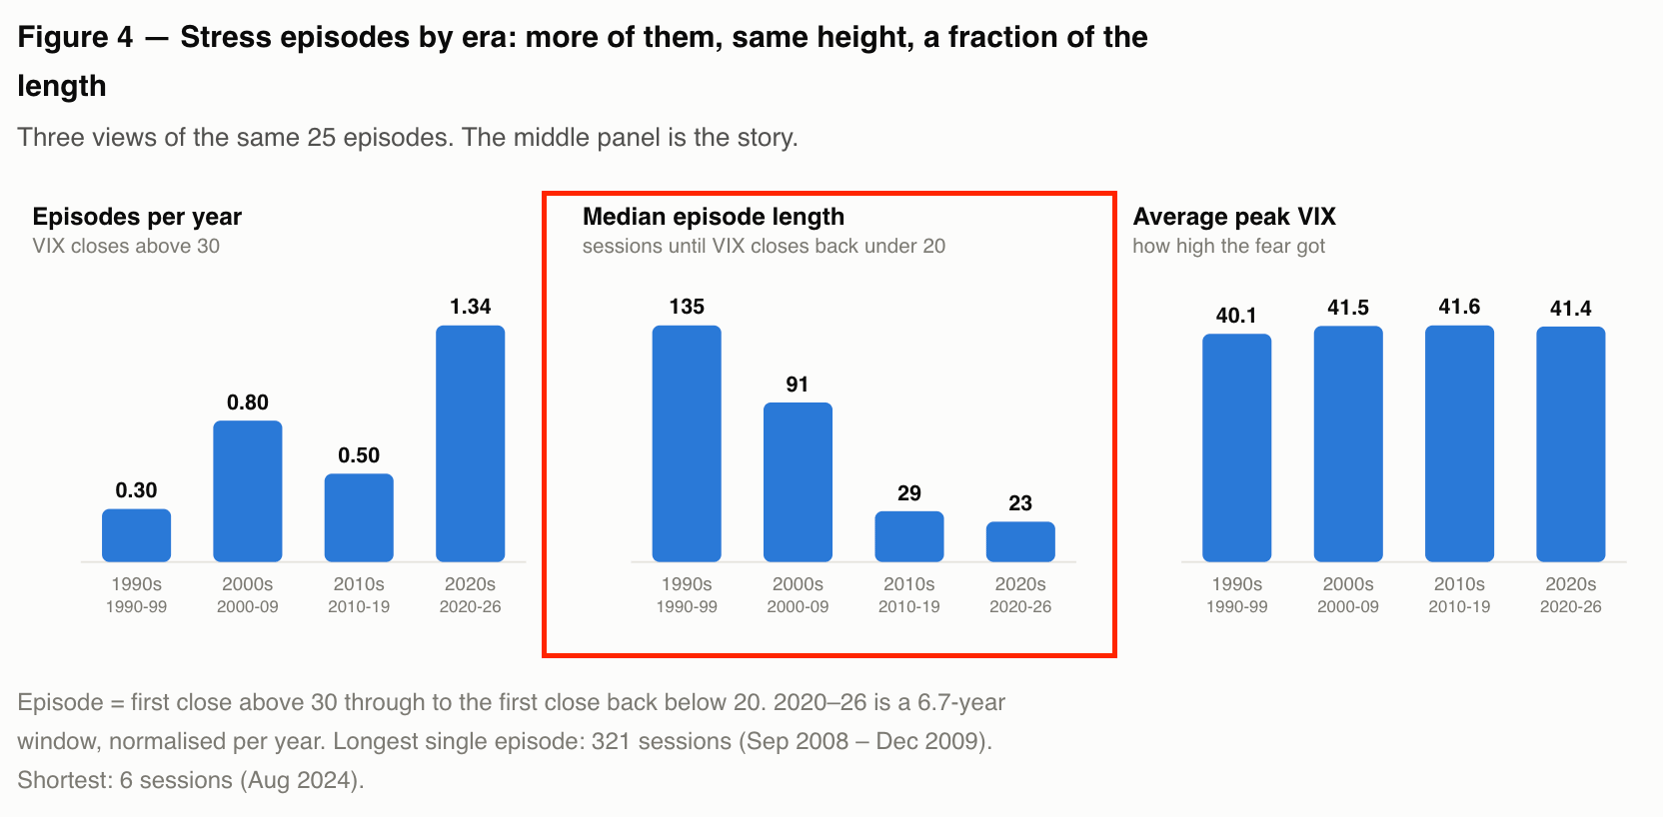
We went looking for the shift ourselves, defining a "stress episode" as any stretch where the VIX closes above 30 and doesn't close back under 20 until the episode ends. There have been 25 of these since 1990. Broken down by decade, the pattern is strange: almost perfectly consistent in one dimension, and completely different in another.
Stress episodes by era, VIX research
Average peak fear has barely moved in 36 years. Panic tops out at roughly the same place it always has. What collapsed is the duration: a median stress episode ran 135 trading days in the 1990s. In the 2020s so far, it's 23. Meanwhile, episodes are showing up roughly four times as often per year (1.34 vs. 0.30).
Mean-reversion speed tells the same story from another angle, the half-life of a volatility shock has fallen from 37.6 sessions in the 1990s to about 20 in the past two decades, roughly three times faster.
Day-to-day price action backs this up separately. The standard deviation of daily VIX moves has risen from 5.76% (1990–2007) to 8.08% (2018–2026), and the number of days per year the VIX jumps 10%+ in a single session has nearly doubled, from 11.8 to 22.0.
Put simply: Fear now arrives more often, hits about as hard as it always has, and leaves faster than it used to.
The market has always been a pendulum, the question is how fast it swings
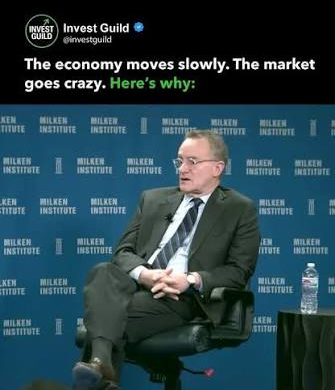
This isn't a new idea. Howard Marks has spent decades describing investor psychology as a pendulum, constantly swinging between extreme greed and fear, optimism and pessimism, rarely resting at the sensible midpoint. As he put it: "Skepticism calls for pessimism when optimism is excessive." The same logic runs in reverse, when pessimism is the one running hot, skepticism is what should pull an investor back toward optimism, not away from it.
It's the same idea we use to frame intrinsic value: PRICE doesn't track a business's actual worth in a straight line. It swings above and below it, pulled by sentiment, news, and short-term positioning, before eventually reverting to the centre, the pendulum's resting point. The mistake most investors make isn't failing to see the swing. It's assuming the swing behaves today the way it always has.
Why this matters more than it sounds like it should
None of this changes the core logic we have long applied to valuation: short-term price is driven by sentiment, not fundamentals, and the businesses that matter are the ones whose intrinsic value keeps compounding regardless of what the price is doing that week. Temporary mis-pricing, the gap between price and value that opens up during a fear episode is still where the opportunity has always lived.
What's changed is the shape of the window. If a stress episode used to stretch across 135 trading days, there was time to watch it unfold, do the work, and act with the business's fundamentals still visible through the noise. At 23 days, that window is a fraction of the size. The pendulum hasn't started swinging any wider. It's just swinging faster, which means the cost of waiting for total certainty before doing anything has quietly gone up.

The caveat: 2026 is not 2025
It's worth being precise here rather than lumping recent years together. On these same measures, 2026 year-to-date does not look like a distributional outlier, its average volatility level sits around the 54th percentile of all years in the sample, and its peak-to-average ratio around the 62nd.
2025, by contrast, sat at the 95th percentile over the same January–August window, with a single stress episode in April that briefly pushed the VIX to a closing high of 52.33.
Two years, same underlying pattern, very different intensity. Flattening them into one story would be exactly the kind of average-driven mistake this whole piece is arguing against.
Final Thought
The market hasn't become a scarier place to invest, it's become a faster one to misread. Opportunities come by and leave quickly. The amplitude of fear hasn't changed in three and a half decades. The cadence has. Understanding roughly where the pendulum sits, and how quickly it's been moving lately, matters more than trying to predict exactly when it swings next.








submit your comment