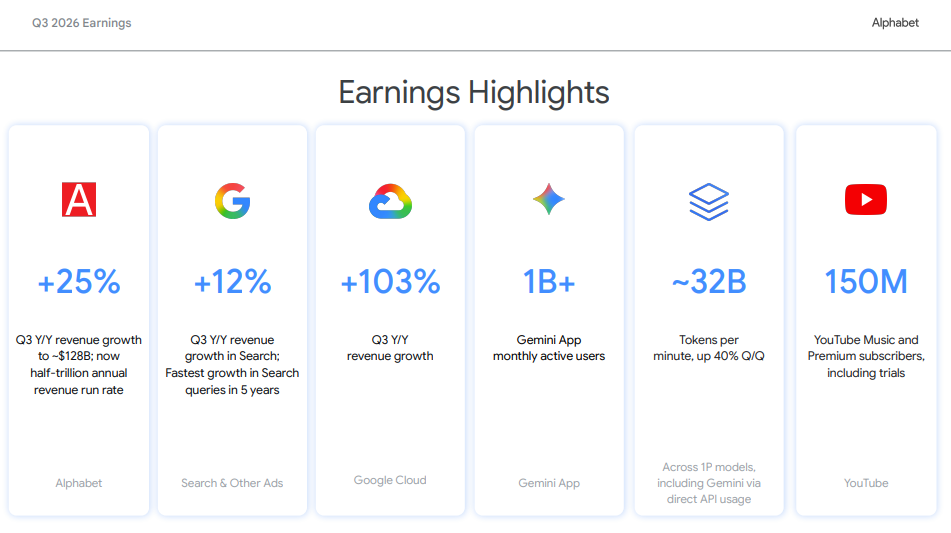
On paper, Alphabet’s third quarter looked like a blowout. Revenue grew 25% to $127.6 billion. Google Cloud more than doubled. Operating income rose 30%. The company is now running at a half-trillion-dollar annual revenue pace.
And yet the stock fell roughly 10%, wiping out more than $280 billion in market value.
So which is it? Is Google in trouble, or did the market overreact? The answer is that both stories could be true at the same time. Some parts of Alphabet’s business cracked this quarter, and some got noticeably stronger. Reading only one side gives you half the picture.
In this article, we go through Alphabet’s Q3 2026 numbers line by line, using the company’s own earnings slides. First we cover what cracked, then what held. We’re not here to tell you Google is a good or bad company, or whether to buy or sell. We want to show you why the headline numbers rarely tell the full story, and what you see when you dig a layer deeper.
Alphabet Q3 2026 at a Glance
src : https://s206.q4cdn.com/479360582/files/doc_financials/2026/q3/2026q3-alphabet-earnings-slides.pdf
Here are the headline numbers, compared with the same quarter last year. All figures are from Alphabet's Q3 2026 earnings report (unaudited, in US$).
|
Metric |
Q3 2025 |
Q3 2026 |
Change |
|---|---|---|---|
|
Total revenue |
$102.3B |
$127.6B |
+25% |
|
Google Search & other |
$56.6B |
$63.4B |
+12% |
|
YouTube ads |
$10.3B |
$11.2B |
+9% |
|
Google Network |
$7.4B |
$7.5B |
+1% |
|
Subscriptions, platforms & devices |
$12.9B |
$14.3B |
+11% |
|
Google Cloud |
$15.2B |
$30.7B |
+103% |
|
Operating income |
$31.2B |
$40.6B |
+30% |
|
Operating margin |
30.5% |
31.8% |
+1.3 pts |
|
Diluted EPS |
$2.87 |
$2.12 |
–26% |
|
Capital expenditure |
$24.0B |
$51.4B |
+114% |
|
Free cash flow |
$24.5B |
–$9.1B |
Negative |
Read that table quickly and you see growth. Read it slowly and you see the tension: the business is growing faster than ever, but the cash it keeps is shrinking fast.
What Cracked
1. Search growth slowed, and AI Mode is part of the reason
Google Search & other revenue rose 12% to $63.4 billion. That would be a fine number for most companies.
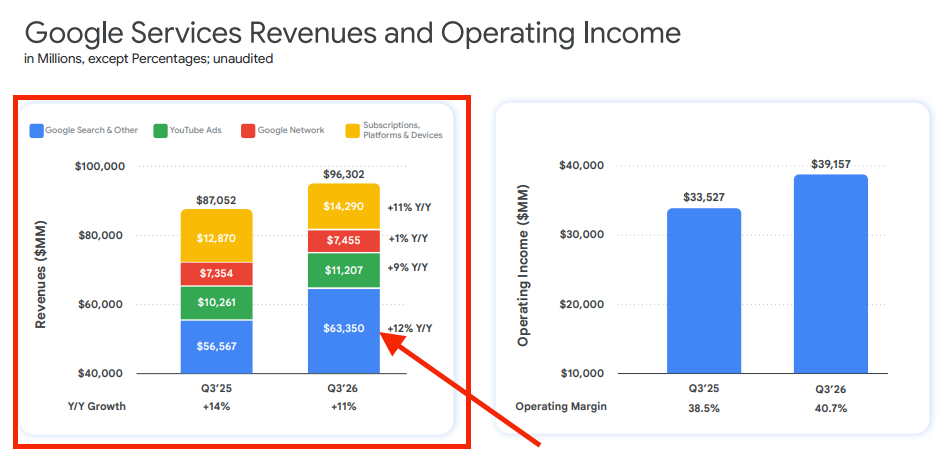
But Search is the engine of Alphabet, and it had been growing faster earlier in the year: around 19% in Q1 and 17% in Q2. Analysts were expecting about $64.9 billion.
Management gave two explanations on the earnings call:
- Currency. Chief Business Officer Philipp Schindler said foreign exchange was "the single largest driver" of the Search slowdown versus Q2. CFO Anat Ashkenazi added that the FX headwind is expected to be slightly larger in Q4.
- AI Mode monetisation. Schindler said "the strong growth in AI Mode queries had an impact because of the lower monetization we were seeing in AI Mode."
The second point is the one the market latched onto. But Google is seeing its fastest growth in Search queries in five years, so people are using Google more, not less.
The problem is that an AI Mode answer currently earns less ad revenue than a traditional page of search results. Google says it is expanding ads in AI Mode, including multi-turn ads in follow-up questions in the US, but investors want proof that those ads can earn as much as the blue links they replace.
This is the crux of the bear case. If AI answers keep taking share from classic search before they are monetised at the same rate, Search revenue growth could stay under pressure even as usage rises.
2. Free cash flow went negative, for the second quarter in a row
This is a crack that most investors latch on as well, and the one that matters for long term valuations.
|
Quarter |
Operating cash flow |
Capex |
Free cash flow |
|---|---|---|---|
|
Q3 2025 |
$48.4B |
$24.0B |
$24.5B |
|
Q4 2025 |
$52.4B |
$27.9B |
$24.6B |
|
Q1 2026 |
$45.8B |
$35.7B |
$10.1B |
|
Q2 2026 |
$39.1B |
$44.9B |
–$5.9B |
|
Q3 2026 |
$42.3B |
$51.4B |
–$9.1B |
A few things stand out:
- Trailing 12-month free cash flow fell 73%, from $73.6 billion to $19.7 billion.
- Capex now consumes 40% of revenue, up from 23% a year ago.
- Capex was 121% of operating cash flow. In other words, Alphabet spent more on infrastructure this quarter than its operations generated in cash.
- Operating cash flow fell 13% year over year even though operating income rose 30%.
That last point deserves context. On the call, Ashkenazi said operating cash flow was hurt by a build-up of inventory for TPU system sales and a $5.2 billion cash payment for a 2018 European Commission fine. Strip out the fine and operating cash flow would have been roughly $47.5 billion, close to last year's level. So part of the cash shortfall is one-off. But even on that adjusted basis, capex would still have exceeded operating cash flow.
3. The spending is not slowing down
Alphabet kept its 2026 capex guidance at $195 billion to $205 billion. Through the first three quarters, it has spent $132.0 billion. To land within that range, Q4 capex would need to be roughly $63 billion to $73 billion, which would be another record.
Now, the market has spent many quarters tracking hyperscaler AI capex, and while the spending numbers are concerning, it's important to note that revenue isn’t slowing down either: Google Cloud, arguably the business most directly tied to that capex, more than doubled to $30.7 billion this quarter, with operating margin rising to 36.2%. It pays to do your own research before drawing conclusions either way, because the cash flow statement and the income statement are telling two very different stories right now.
4. The EPS miss: part accounting noise, part not
Diluted EPS fell 26% to $2.12. The biggest reason is below the operating line. "Other income (expense)" swung from a $12.8 billion gain a year ago to an $8.2 billion loss, a $21 billion swing. Management attributed the loss "primarily to unrealized loss from our investment in SpaceX."
Add the $0.55 back and EPS would be about $2.67, still below the ~$3.02 consensus.
5. The rest of the ad business is soft
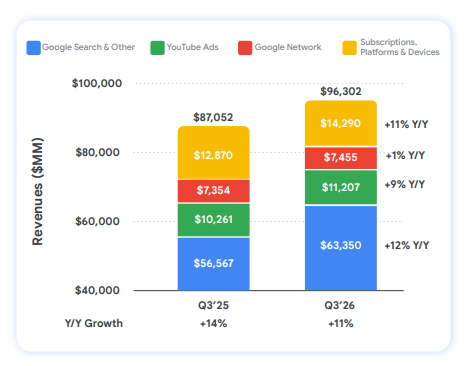
Outside Search, advertising growth was modest:
- YouTube ads grew 9% to $11.2 billion.
- Google Network, the ads Google places on third-party sites, grew just 1%.
- Google Services overall grew 10.6%, down from 14% in the same quarter last year.
With management flagging a larger currency headwind in Q4, mainly in Search and YouTube, there is little sign of an immediate re-acceleration in the ad business.
What Held on with Google latest earnings
Several parts of the business were stronger than ever.
Google Cloud doubled, and became far more profitable
|
Google Cloud |
Q3 2025 |
Q3 2026 |
Change |
|---|---|---|---|
|
Revenue |
$15.2B |
$30.7B |
+103% |
|
Operating income |
$3.6B |
$11.1B |
+209% |
|
Operating margin |
23.7% |
36.2% |
+12.5 pts |
Cloud now makes up about 24% of Alphabet's revenue. Growth like this at a $120-billion-plus annual run rate is extremely rare. Margins expanding at the same time is rarer still.
Just as importantly, the pipeline is large. Management reported a Cloud backlog of $561 billion and expects to recognise just over 55% of it as revenue over the next 24 months. Cloud is the could be the clearest evidence so far that Alphabet's AI spending is turning into revenue.
Margins expanded, even with record spending
- Group operating margin rose to 31.8% from 30.5%.
- Google Services operating margin rose to 40.7% from 38.5%.
- Gross margin held steady at about 59.7%, despite rising depreciation.
- General & administrative expenses fell 17%.
The income statement is still showing operating leverage.
People are using Google more, not less
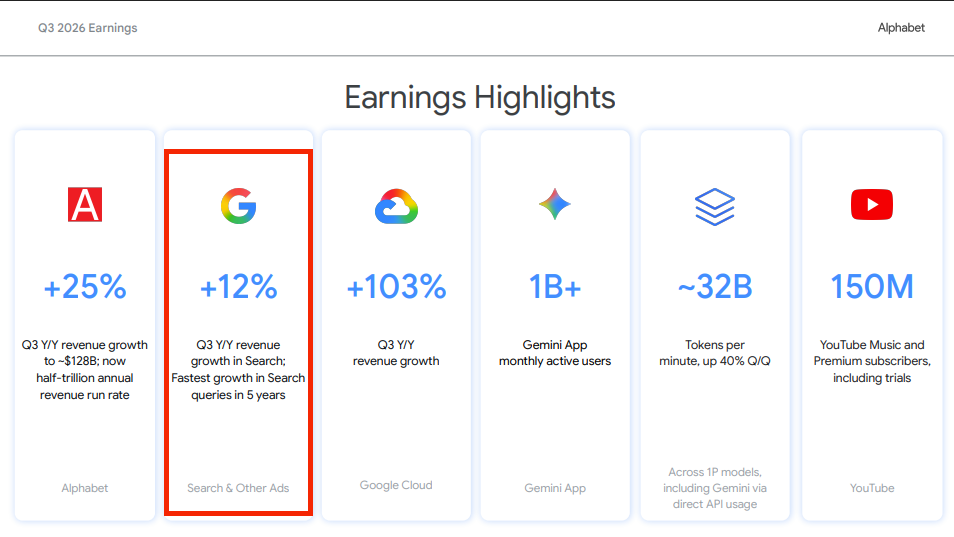
Search query growth was the fastest in five years, according to Alphabet's slides. That matters because the bear case for Google has long been that AI chatbots would pull users away. In Q3 2026, the evidence points the other way on usage. The open question is monetisation, not demand.
AI adoption metrics kept climbing
- The Gemini app passed 1 billion monthly active users.
- Alphabet now processes about 32 billion tokens per minute across its first-party models, up 40% from the previous quarter.
- YouTube Music and Premium reached 150 million subscribers, including trials.
- Subscriptions, platforms & devices revenue grew 11% to $14.3 billion.

Is the Drop Justified? Weighing Both Sides
Reasonable investors can read this quarter very differently. Here is how the two sides frame it:
|
Question |
The bear case |
The bull case |
|---|---|---|
|
Search |
AI Mode is cannibalising higher-value search ads before it is monetised. |
Queries are growing fastest in five years; FX was the bigger drag and AI Mode ads are still rolling out. |
|
Cash flow |
Two negative FCF quarters, with capex set to rise again in 2027. |
Part of the cash drop was one-off (EC fine, TPU inventory). Spending is front-loaded ahead of demand. |
|
Returns on capex |
No guarantee $200B+ a year earns an adequate return. |
Cloud revenue doubled, margins hit 36%, and backlog stands at $561B. |
|
Shareholders |
Equity raise, preferred stock and a rising share count dilute per-share value. |
External capital lets Alphabet build capacity without levering the balance sheet. |
|
Earnings |
EPS missed even after adding back the SpaceX loss. |
Operating income grew 30%; the SpaceX loss is unrealised. |
Neither side is obviously wrong. What the market did on 29 October was to reprice the risk that Alphabet's cash generation stays depressed for longer than expected.
Final Thoughts
Just like after any earnings, we ask ourselves the same question. Is the business still strong? And is the price still reasonable for what the business will generate?
A sharp drop can mean the market has overreacted to short-term noise. It can also mean the market is correctly marking down the future cash a company will produce. The way to tell is to go back to fundamentals: free cash flow, return on invested capital, competitive moat, and an intrinsic value estimate that reflects realistic assumptions, not the most optimistic ones.
For a capex-heavy company like Alphabet right now, that means stress-testing your valuation under different scenarios for how quickly free cash flow recovers.










submit your comment