It's the start of a new month, and time for monthly market analysis.
Table Of Contents
How Is This Drawdown Affecting My Portfolio?
The Reason Why So Many Fail In The Markets
Why I'm Underperforming The Market SO FAR This Year
Great Companies Are Getting Hit The Hardest
The 'Bearish' News & 'Bullish News'
What Must Happen For The Market To Change Sentiment?
Technical Indicators I'm Looking At
Current State Of The S&P 500
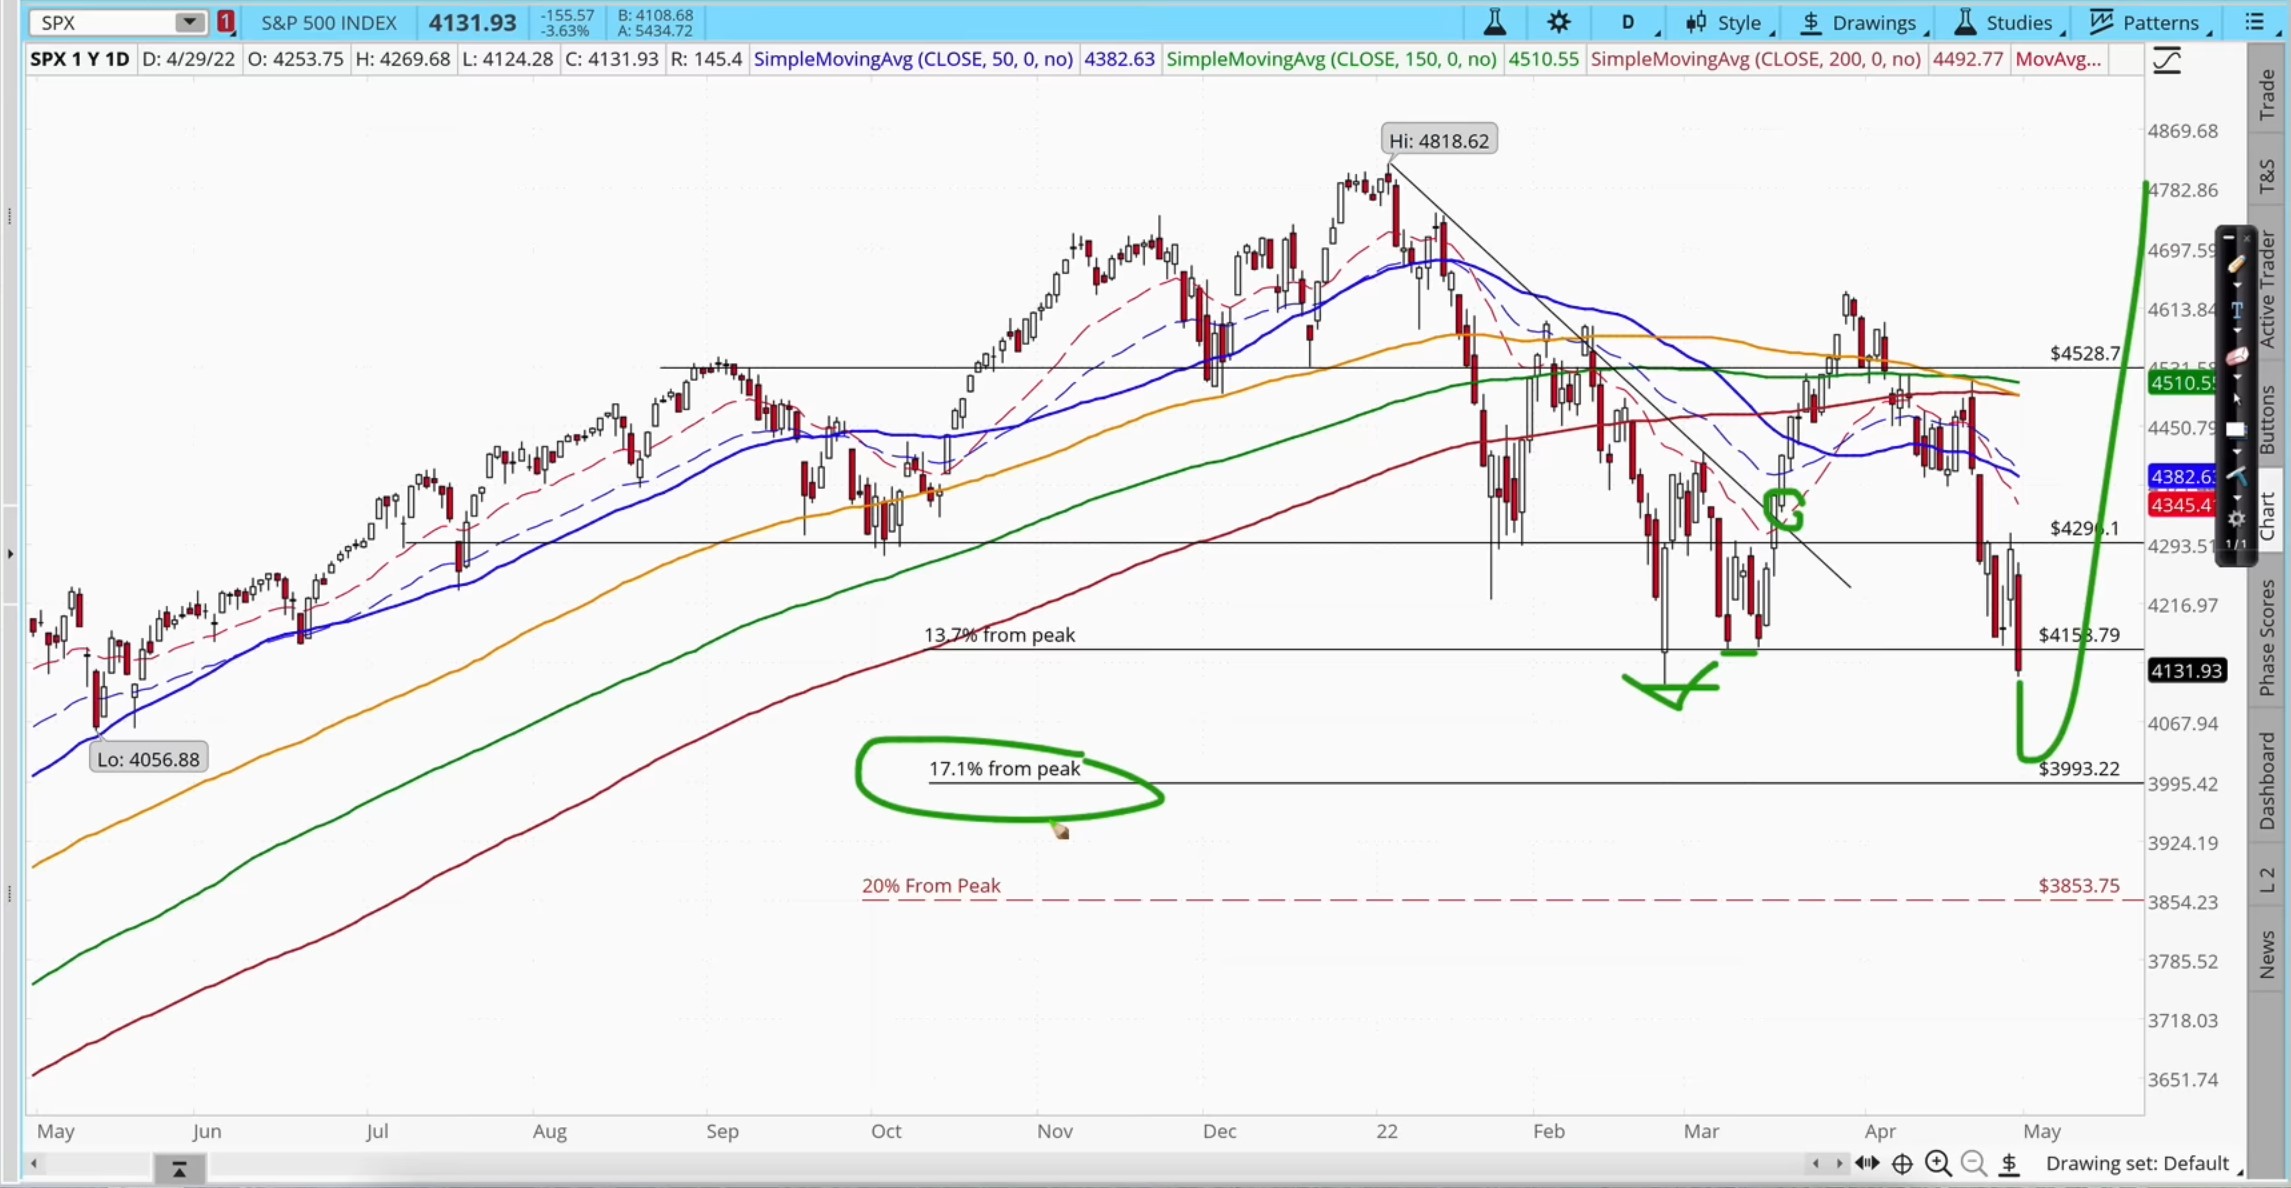
Let's start off with the S&P 500. It continues to be in this downtrend consolidation pattern. We had a break above the resistance in the middle of March when it made that first low.
I thought "Hey, okay that's it, that's the low for the year we're now going back up."
It did go back up, but then it hit resistance, failed to break through, and came back down again. So we can't predict the market exactly as you guys know. We're down again, and now we have gone below that previous support, but still above that swing low in the middle of March.
I won't be surprised that in the next few days, we will go lower and retest those lows and possibly exceed those lows. Usually, a bottom forms when you've got a double-bottom, and the second bottom exceeds the low of the first bottom. In other words, it goes below the previous low and then reverses back up.
That could be a possibility.
Another possibility could be that it could test all the way down to 17.1% which I did mention earlier this year because I said that usually in a U.S. Midterm Election Cycle, the market has been known to correct down to 17.1% on the S&P 500, so we'll see how that goes.
But the S&P 500 technically is not in a bear market yet although it looks like almost every stock that we own is in a bear market. The NASDAQ's in a bear market, but the S&P 500 is holding up pretty well because of energy, staples, and utilities.
In a way, I agree with what some of you are saying that this actually feels like a bear market. It's kind of like a 'stealth bear market' where a lot of the good companies we own are down 20%, 30%, and 40%, but the S&P 500 doesn't show it's a bear market because it's being held up by certain parts of the market like I said the energy, utilities, and the consumer staples.
Even though it's not a bear market, it might as well be a bear market because most of our stocks are down more than 20%, which I'll go into depth in the portfolio review.
Year-to-date, the S&P is down 13%, and the NASDAQ is in a bear market.
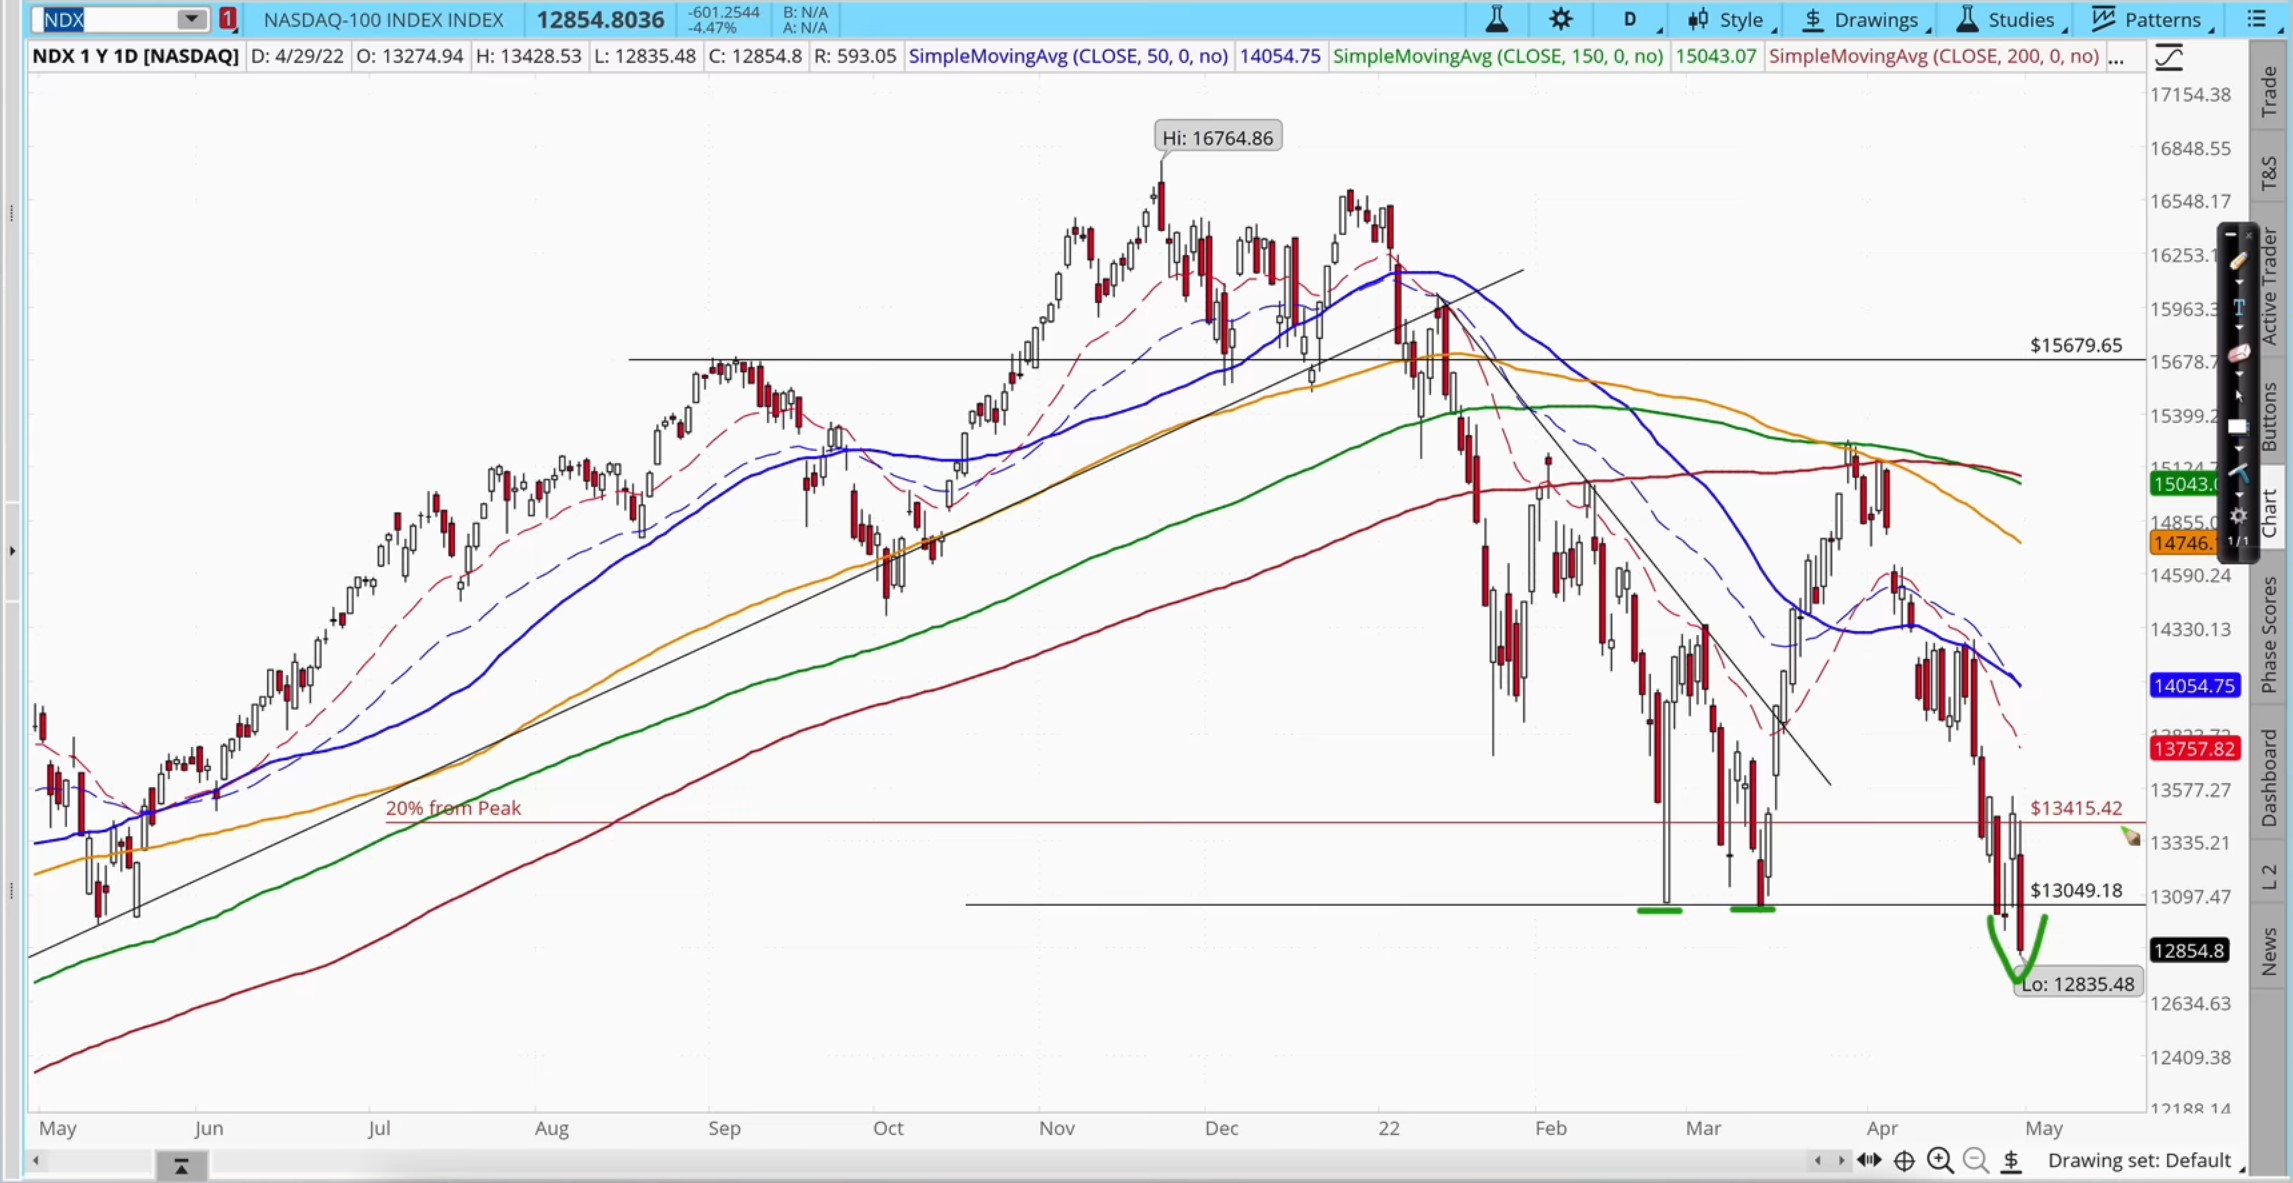
A bear market means the market closes 20% below the high, and if you look at the NASDAQ — we are down below the March lows. This could be a sign of a double-bottom, you never know.
It could double-bottom if it forms a strong bullish candle — we could reverse back up next week. The bad news is that it's below the 20% peak, so NASDAQ is in a bear market.
How Is This Drawdown Affecting My Portfolio?
So the NASDAQ is down 23%, S&P 500 is down 13%.
My portfolio is down 27% year-to-date.
This is a bigger drawdown than what I had in March 2020 during the Covid crash During that crash, my portfolio was down 26%, but now it's down 27% — this is huge!
A lot of investors would feel upset or feel scared.
By the way, in terms of dollars, I'm down like $1.3 million from the top. Now I'm not upset, I'm not worried, and I'm not fearful. In fact, I'm still pretty optimistic, and pretty excited, and it's not because I'm crazy. It's because I've been in the markets for 30 years.
I've gone through so many bear markets, I've been through so many corrections, and I went through the 2000, 2008, 2018, and 2020 crashes. After every bear market — after every crash — I always got richer eventually. Every time my portfolio dropped by 20%, it'll go up by 50% or 100%.
In fact, in March 2020, when my portfolio dropped 26% during March 2020, it ended the year up about 48%. Then in the following year in 2021, my portfolio was up another 46%.
So overall after dropping 27%, my portfolio went up 100%. So this will be no different. Yeah, my portfolio may be down 27% right now, but by the end of this year, or maybe next year, or the year after that, it's going to be up like 50% to 100%.
I know that for certain because I'm invested in great companies that are undervalued, and it'll always go up eventually. My confidence comes in understanding the businesses that I own.
The Reason Why So Many Fail In The Markets
Now some critics would say "But Adam if you're so smart, why are you down? If you're so smart you could have seen the crash coming — you should have sold everything at the top, shorted the market at the top, and bought commodities — and now you wouldn't be down at all. You would be like up every year, every day, every month."
Well, it's because I don't have a crystal ball, dumbass, and no one has a crystal ball.
So the reason why a lot of people fail in the markets is that they come in with unrealistic expectations, thinking that as a great investor, you can see the future — you know exactly where's the top, exactly where's the bottom. Most people fail because they come in with these naive expectations.
Hey even the greatest investor in the world — Warren Buffett — who's been investing for the last 80 years, his portfolio doesn't go up in a straight line. It goes down as well. In fact, he has seen his portfolio drop up to 50% more than 4 to 5 times in his career.
There's only one guy on Wall Street whose investment portfolio never goes down — it goes up every single year without fail, and has never dropped at all.
His name is Bernie Madoff.

He was found to be the greatest scammer and fraud on Wall Street because all his investments were fake. It was a huge Ponzi scheme, and he was sent to jail for 100 years and he died in jail.
So the point is this:
If anyone tells you that they can see the future, they can sell at the top, they can buy at the bottom, their portfolio always goes up, it's a freaking fraud, okay — it just doesn't exist. So if you think that way, grow up! Don't be so naive all right.
So like I said, I'm not fearful. I'm excited because I know that it's part of the journey.
It's kind of like marriage. You can't have a great marriage without arguing once in a while, and after every argument, that should strengthen your marriage. It's unrealistic to think that you're gonna have a marriage for like 50 years, never argue, stay happy every single day. . . yeah, try. Try that, go ahead, best of luck.
It's the same thing with a business.
In business, you can't always have sales. You've got to have sales, cost of goods sold, and that gives you profit. So I look at my portfolio the same way.
When my portfolio goes up, it's like sales, sales, sales, but I can't have sales all the time. I've got to have some costs once in a while before the next sale, and remember that the market is kind of like a breathing pattern right — breathe out, breathe in, breathe out, and breathe in.
No matter how strong you are you can't breathe out forever. It's impossible. You've got to breathe in once in a while before you can breathe out even further.
So the market is designed in a way that you have to take 1 step back in order to take 3 steps forward. Sometimes you take 3 or 4steps back like now, to take 8 steps forward.
So once you understand that that's how the market works you don't get upset, you don't get concerned during these drawdowns — you expect it, you anticipate it, you go with the process, and you enjoy the process.
I always say "Enjoy the journey. It's not just the destination, it is the journey."
I tell people that if you buy a portfolio of great companies with underlying good businesses, and you buy them at reasonably good prices, you don't have to buy at the bottom. As long as you buy them when they're undervalued collectively, it is impossible to lose money.
It is impossible to lose money because eventually, they will go up again to new all-time highs.
The only way you can lose money is if you sell halfway at bottom prices because of fear — because you panic halfway. As long as you invest with money you don't need urgently, and you don't invest with borrowed money, there's no one forcing you to sell. You just hold it through those ups and downs.
The stock market is like a roller coaster. The only people who get hurt on the roller coaster are those that jump off the ride halfway. If you stay on the ride and enjoy the roller coaster you will reach the destination eventually.
Why I'm Underperforming The Market SO FAR This Year
Let's take a closer look at what is under the hood of the S&P 500.
The index is down 13%, but my portfolio is down 27% and I would guess that for many of you, a lot of the companies that you hold are down more than 20%.
So you may say "Why? Why am I underperforming the market now?"
The reason I am underperforming the market SO FAR this year is that my portfolio is concentrated in technology companies, consumer discretionary, and communications services.
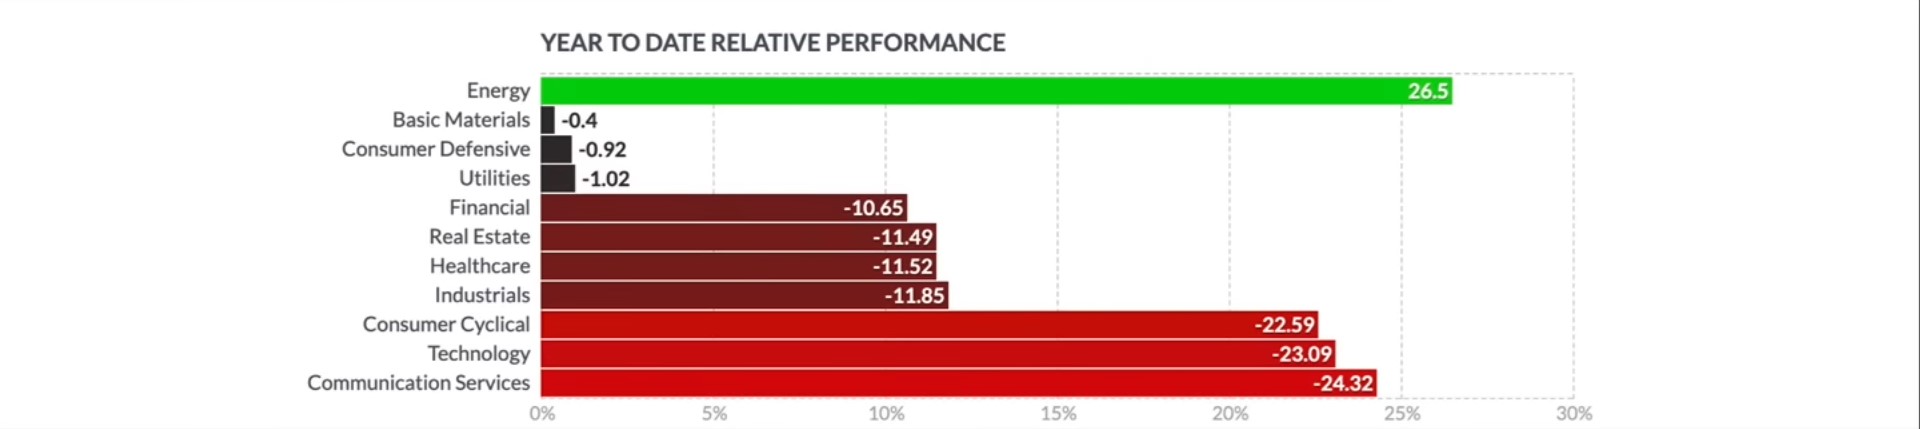
It just so happens that now, these are the sectors that are down the most. If you take a look at the year-to-date, you can see Communication Services, like Facebook & Disney for example, is down 24%. Technology companies like Microsoft & Salesforce are down 23%. Consumer cyclical which are consumer discretionary stocks like Nike and etc. that I own are down 22%.
So my portfolio is concentrated in the 3 sectors that are getting bashed the most so far this year. Of course, I've got a bit of Healthcare, Real Estate, and a bit of Industrials which are also down 11%.
So in my portfolio, I don't have any exposure to Energy, I don't have any Basic Materials, Consumer Defensive I have a few, and I've got no Utilities. So notice that these are the ones that are propping up the market, and that's why I'm underperforming — because I don't have these sectors.
I don't have these sectors because, in the long run, the Technology, Communication Services, Consumer Cyclical, Healthcare, and Financial sectors outperform the market. These are the sectors with the highest growth, highest profit margins, and are comprised of companies with the strongest economic modes.
But in the short term, they're not doing well because the market sentiment is kind of going away to away from growth, away from innovation, and towards all these safe sectors.
Should I sell my stocks and buy these ones that are going up?
That's what some people are doing right? They sell the out-of-favor stocks and buy the ones in favor, hoping to catch that trend.
I don't want to do that because right now these sectors are pulling up the market, but they are overpriced, and in the long run, they don't perform.
So I'm gonna stick with the sectors I have and use this opportunity of a big drawdown to slowly keep buying shares into the company.
I always say that "This is a crisis, and never let a crisis go to waste. Use it as an opportunity, so that when it turns around and markets normalize you would really, really, outperform the market again and make a lot of money."
I've got no doubt of that, and I'm sticking to the investment plan. Always stick to the investment plan, don't change it halfway to go chase what looks nice and abandon what you have.
There's a very old saying in ice hockey by Wayne Gretzky.
So that's what we do in investing.
Great Companies Are Getting Hit The Hardest
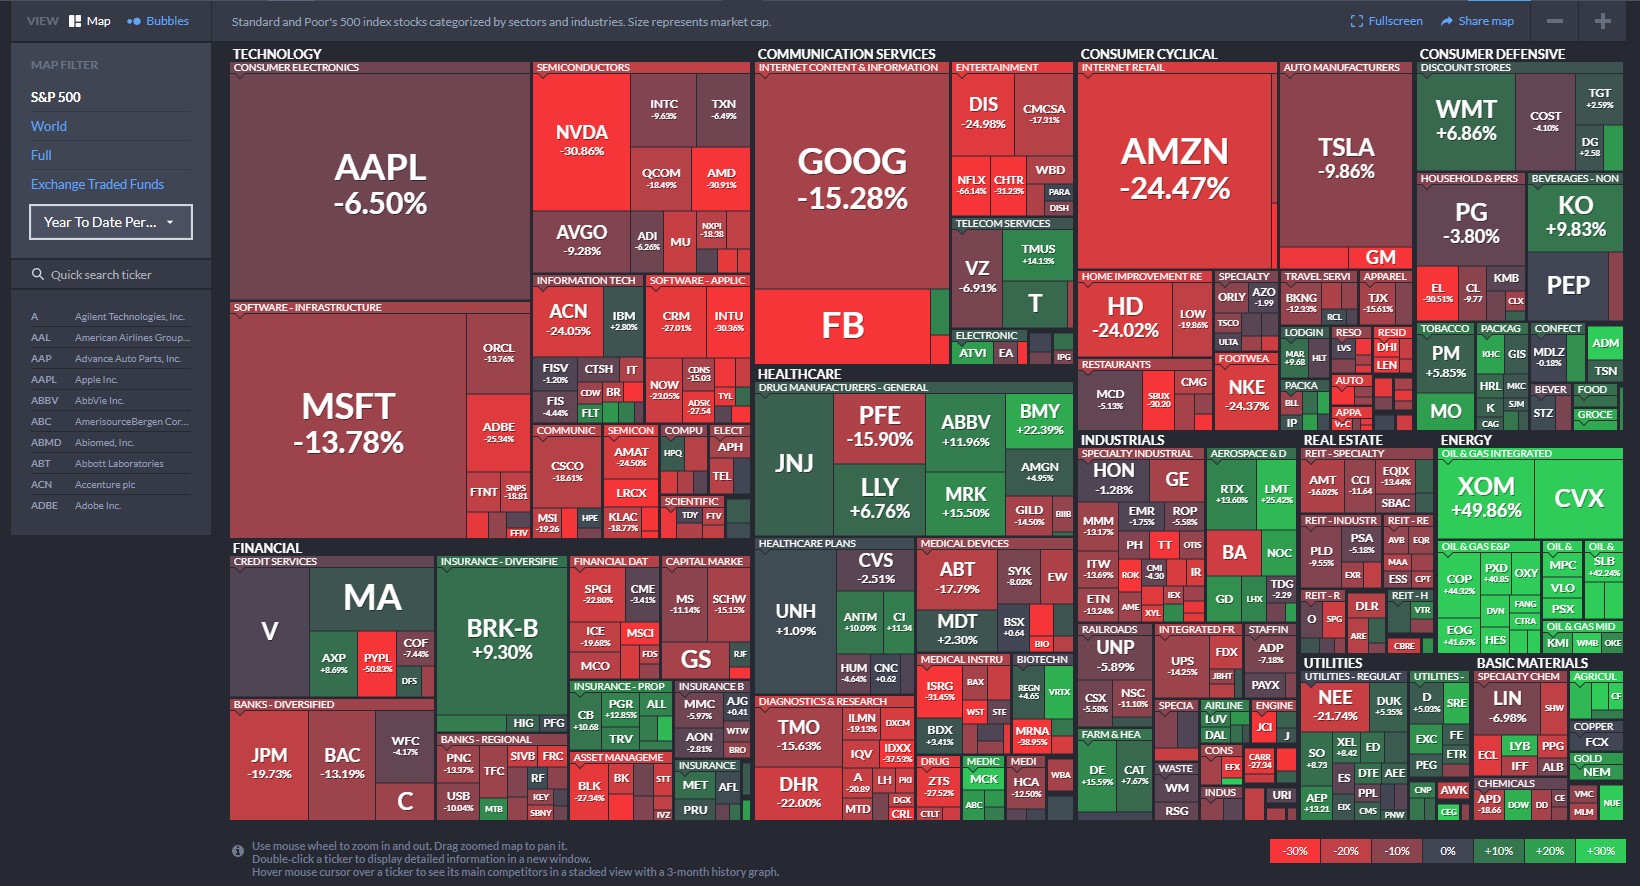
Now if you take a look at the S&P 500 component companies, you can see that again, the majority of the great companies with growth & strong economics are the ones that are getting hit the hardest in this very strange market.
The ones that are green, holding up the market, are the energy stocks. I don't own any of them because in a long run, energy companies have low profit margins, are unpredictable, and underperform in the long run — so I don't touch any of those.
I have no regrets about not going with energy stocks in the short term because I'm sticking to my plan. I've got a bit of health care — should have bought more, but I've got a bit of it. So that's holding my portfolio up. Basic Materials and commodities are also pulling the market up.
So if you're like me and your portfolio is underperforming the market, and you're wondering why you're down 20% or 30% when the market's only down 13%, you're not alone. A lot of us are going through that, including me. But don't worry, when things turn around, it would flip the opposite and you will way outperform the market.
The 'Bearish' News & 'Bullish News'
Now first, the bad news, and then the good news. Well, actually there's no such thing as bad and good news. It's like what Master Oogway says in Kung Fu Panda:
"There's no good news, there's no bad news, there's just news."
The bearish news is this:
This year has been pretty historical because from January to the end of April, we have seen the 3rd worst 4 months since 1932.
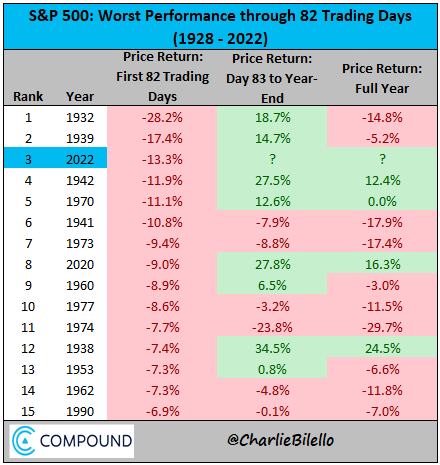
We can see that right now we are down 13% for the first 4 months of the year, and this is the 3rd worst decline in the last 90 years so it is a historic moment. Be proud that you are going through this, and you'll get out of it stronger. So what was worse was 1932 — it was down 28% for the first 82 trading days, January to April. 1939 was worse as well, so we are the third worst, then it was 1942 which was down 11%, 1970 so and so forth.
For the 2 years that were worse than what we're going through right now, what happened from May to the end of the year? What happened in the next 3 quarters of the year was that the market gained 18%.
Normally when you got a really bearish 1st half or first quarter, we tend to have a bullish 2nd half. That tends to happen most of the time. Although 1932 ended down it ended down 14%, it's not as bad as how it started. In 1939, the 2nd part of the year was bullish and it kind of like pared a lot of those early losses, but it still ended down 5%.
So this year we're just finishing that 1st quarter of the year and for the 2nd quarter, I'm pretty optimistic that we will be bullish in the 2nd part of the year. We may still end down, but chances are we won't end as down as where we started this year. Of course, there are times when you end down the 1st quarter but you could still end the year up.
Of course, you could get the entire year down as well, that's still possible, but you can see more often than not the 2nd part of the year tends to be up if the 1st half is down — not all the time but there is a tendency.
So that's the more bullish news. So I do expect we should have that bounce.
What Must Happen For The Market To Change Sentiment?
The main thing that's pulling the market down right now is this high inflation. This high inflation is what's causing the FED to be forced to raise interest rates very fast, and tighten their monetary policy.
Of course, this inflation is being exacerbated — being made worse — because of the war, and also because of supply chain problems due to China's 'Covid Zero' policy.
So for the sentiment to turn what needs to happen?
What needs to happen is we need to see inflation start to peak and then come down.
For that to happen, what would help is:
- If there's a resolution to the war.
- China begins to loosen its 'Covid Zero' policy
- Demand starts to drop
So all these factors combined are what we need for the market to turn around.
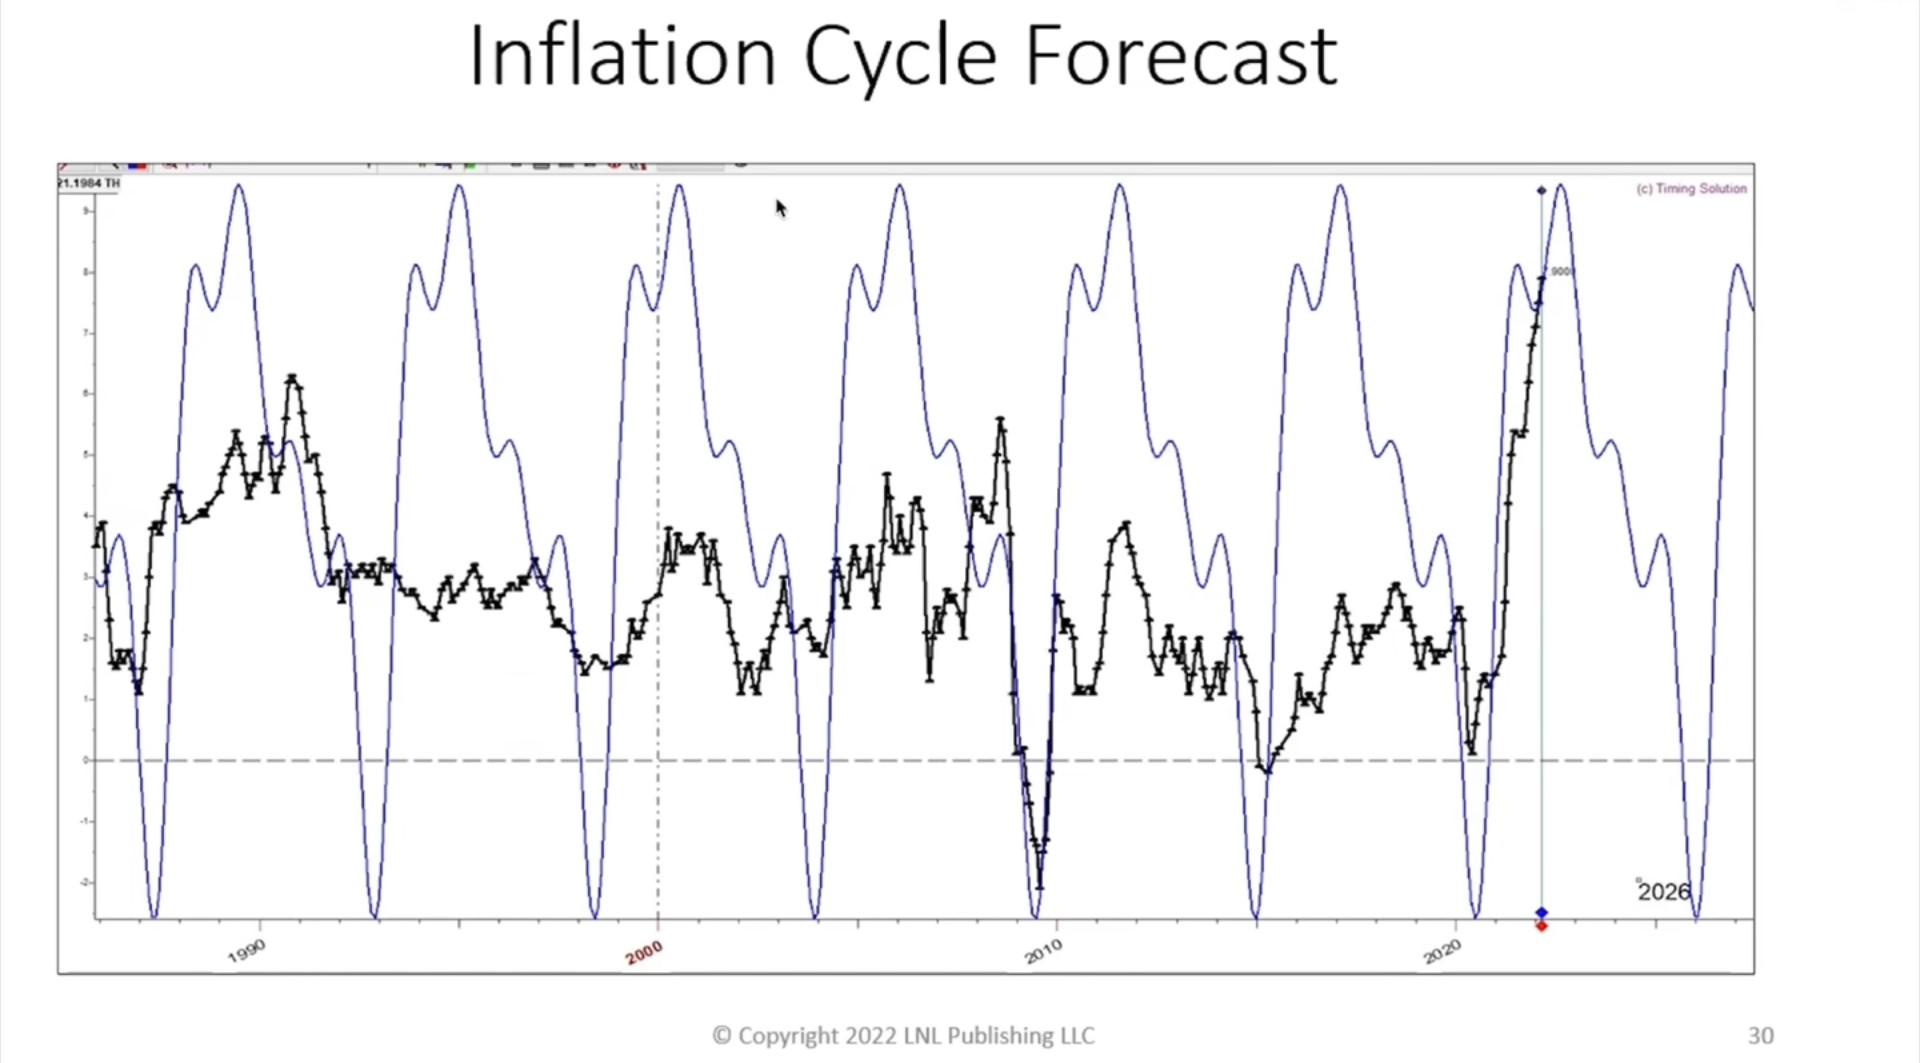
This is from Larry Williams who's a legendary trader and has been trading the markets longer than I've been alive in this world.
What Larry does is that he does a lot of forecasting of cycles, and one of the interesting forecasts that he did was of inflation. You can see that inflation, like everything else, follows a cycle.
So the blue line represents the cycle, and the black line represents the actual inflation data. You can see that going back to 1980, 30+ years ago it's pretty accurate. I mean it's not perfect but you can see that cycle. Right now, we are right up there at about an 8% inflation rate, and it looks like we are nearing the top of this cycle, that it should begin to turn down.
Now based on this cycle forecast, this should happen somewhere between the end of June to early July.
In other words, end of June to early July, when inflation peaks and begins to come down, that's when we may see sentiment begin to shift and the market go up really strongly.
It could happen before that, maybe in May, but it could be up to even June and July. Again these other slides are from Larry Williams; I do suggest you watch his great video on youtube.
You can see that whenever inflation peaked and came down, that was a great bottom in the markets. You can see it over here:
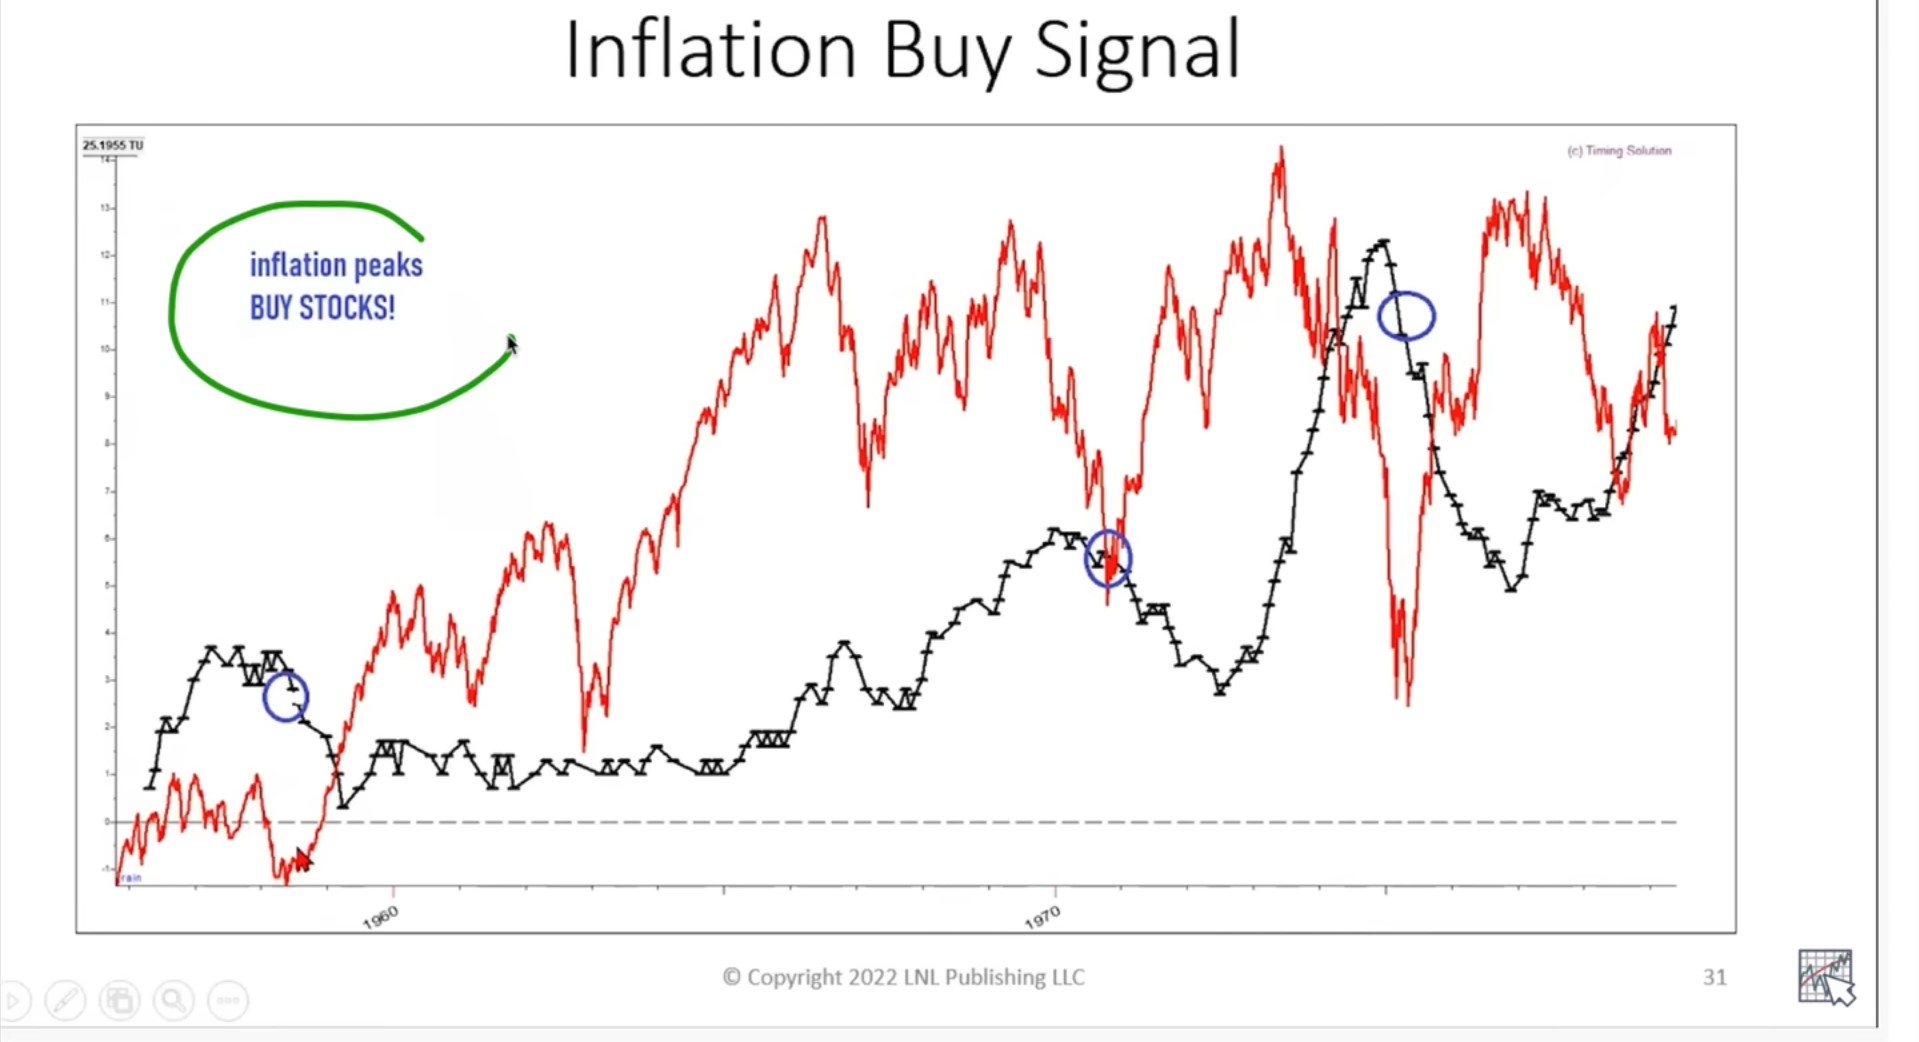
You can see that there's a pretty consistent pattern above.
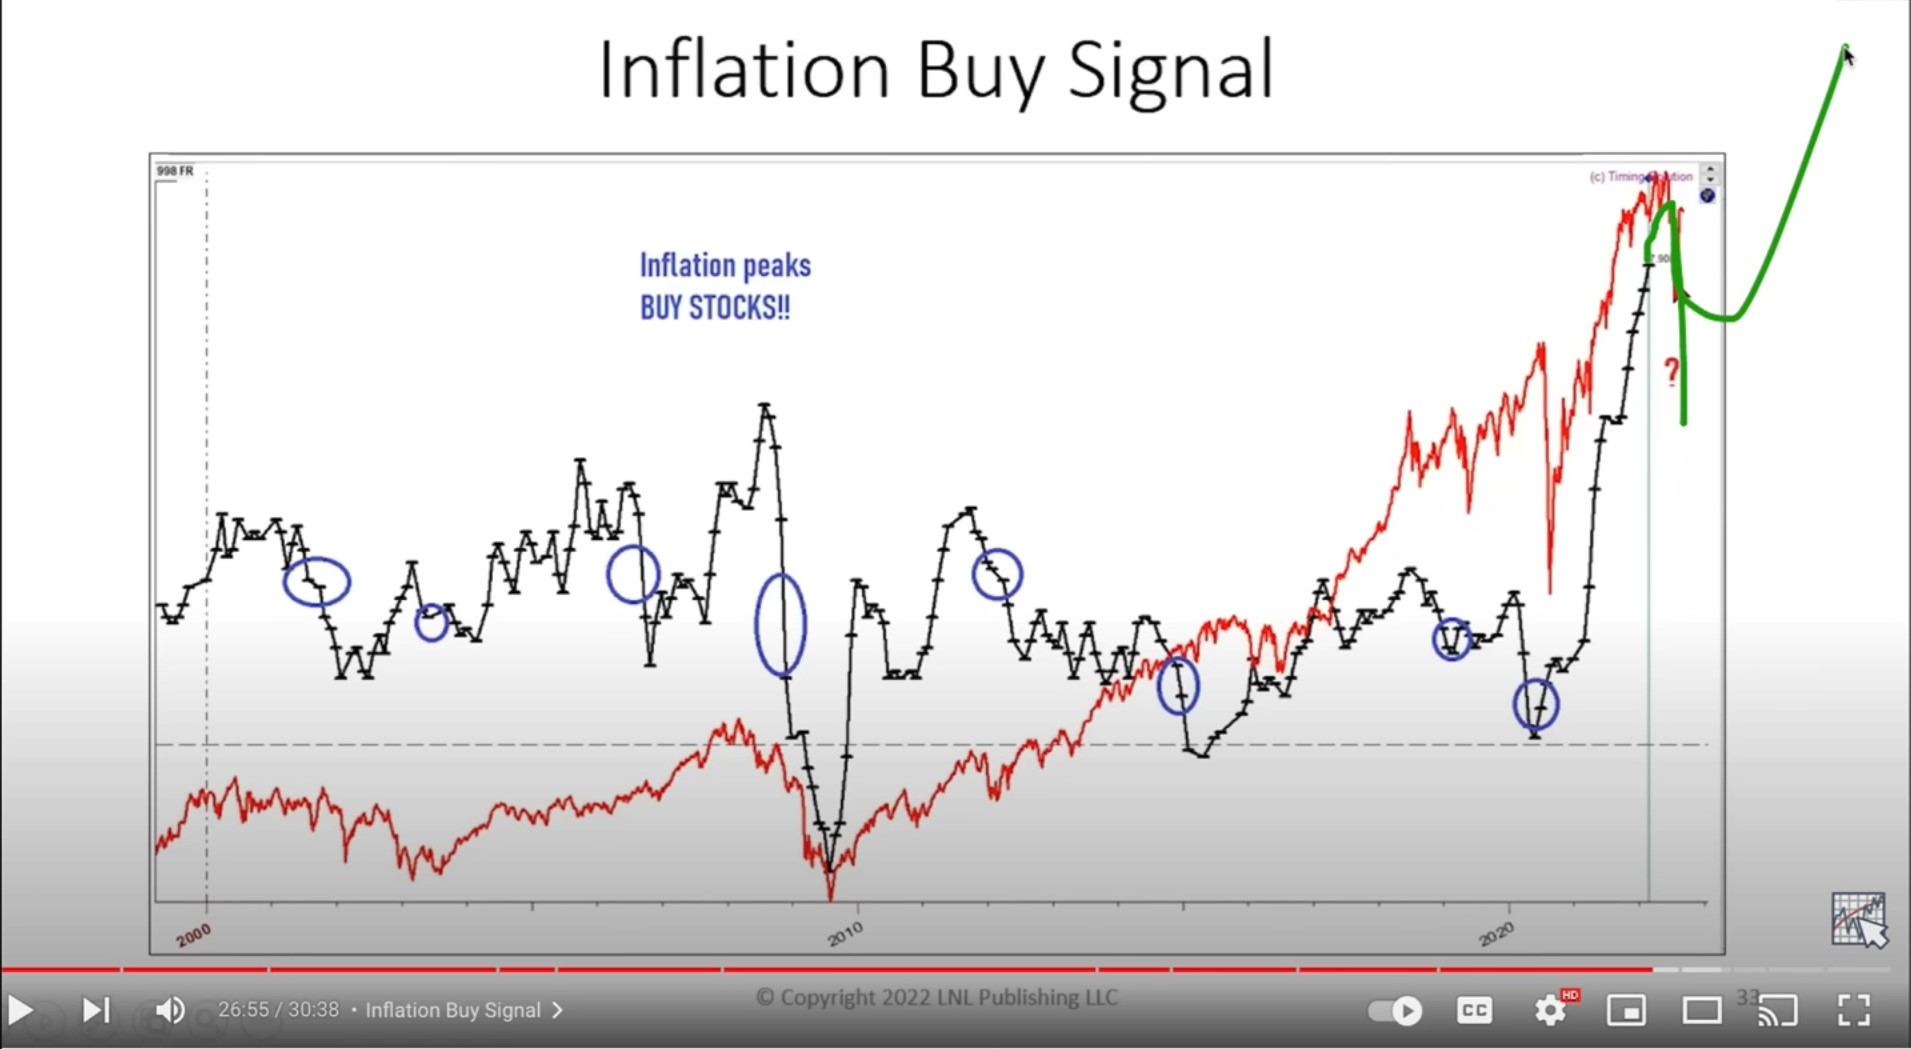
If you look at where we are currently, we are here on the right. Inflation is really at a super all-time high — the highest in about 40 years. It's gonna peak eventually.
So once that peaks and it comes down in the next 1 or 2 months, then the market would have a reason to turn around. So that's something that I'm looking at.
Technical Indicators I'm Looking At
I'm also looking at this bottom fishing indicator. This famous indicator that I pulled out during the March 2020 crash. It worked then, so let's see if it works now.
I'm looking at the S&P 500 on weekly candles, and there are 2 indicators:
- Williams %R | 52 Close
- Normalized ATR
What makes it pretty powerful is if you look at history, every time William's %R line drops below -80 which is the OVERSOLD level, it tells you that the market is oversold like a rubber band, it's gonna it's over-stretch and it's gonna snap back up!
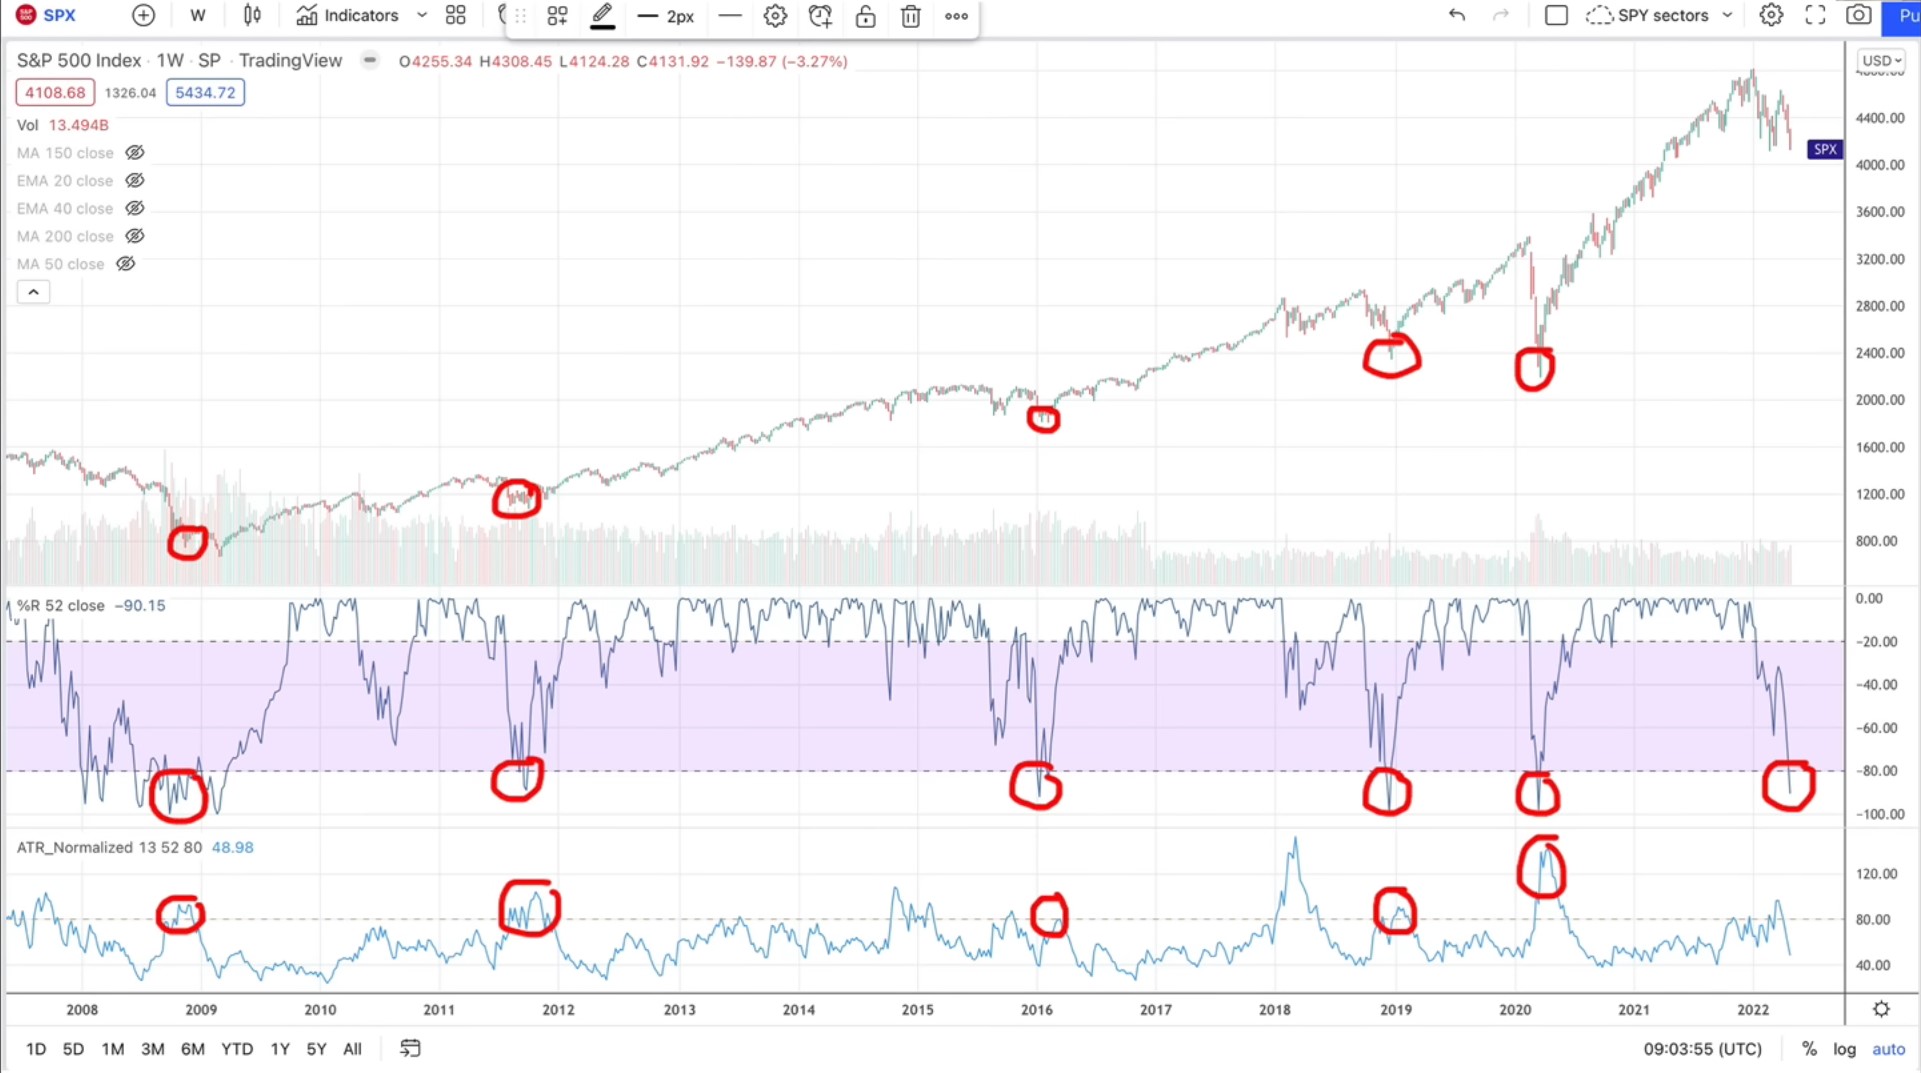
But you can't just look at this alone. You have to also look at Normalized ATR.
So the pattern we have found is that when the Normalized ATR goes above 80 and Williams %R goes below -80, and they happen at the same time, that tends to be a pretty good bottom in the markets
So right now you can see that William's %R has dropped below -80 and this has happened only 5 times in the last 14 years, so it's not easy to get below that. But this Normalized ATR is now back below 80, so this signal is not yet valid.
If it goes back above 80 and William's %R stays below -80 that would be a very powerful bottoming signal, so I'm watching this closely to see when that would take place.
Again, I'm looking at many things. It's not just one thing I'm looking at.
But remember, as investors, we don't have to predict the exact bottom — we don't have to buy at the exact bottom as long as we buy consistently when it's undervalued, and we average in our position somewhere near the bottom, it's fine.
We will make a lot of money when it rebounds eventually. We don't have to catch the exact bottom and I'm doing this more for entertainment purposes. It's not critical to make money. We will make money regardless of whether we catch the bottom or not.
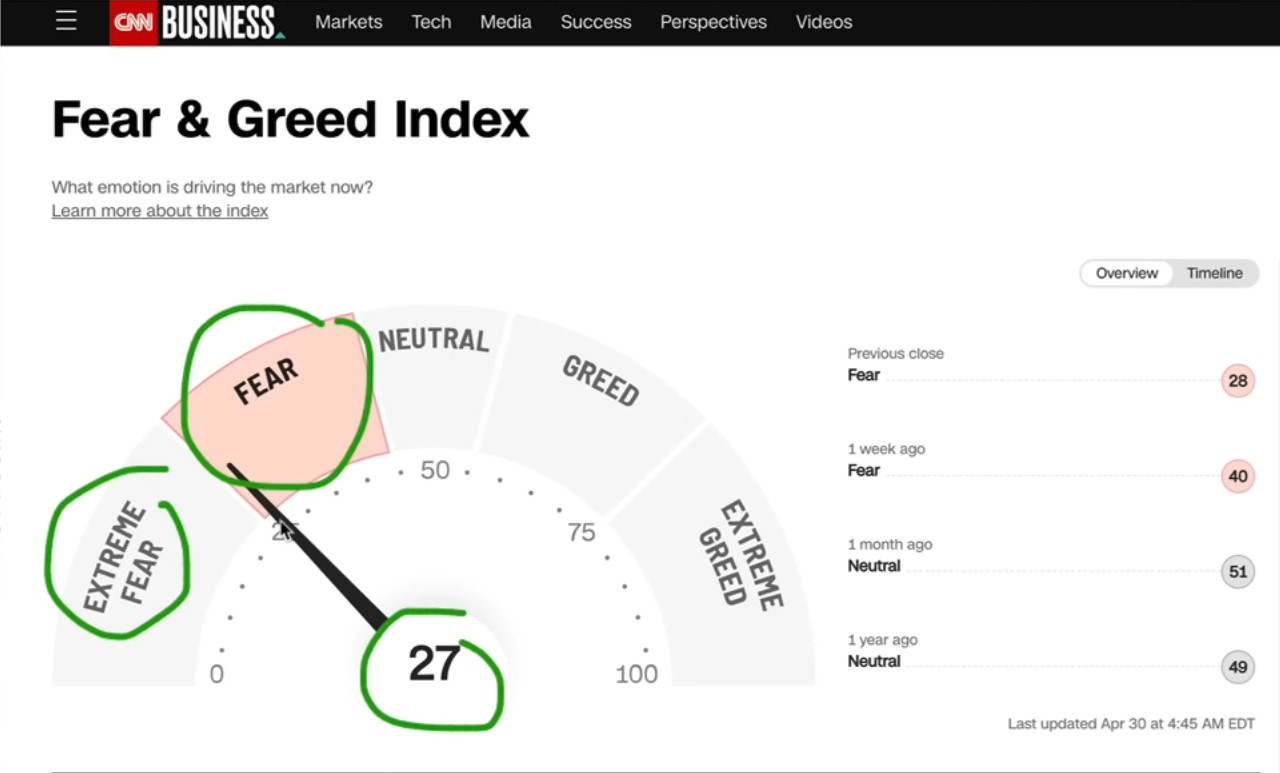
The other thing is the Fear & Greed Index. As of the time I made the video, the Fear & Greed Index was at 27, which was still at the 'Fear' stage. So, if the market goes down a bit more in the next few days, we could go to 'extreme fear'.
Extreme fear is good because when the market gets really scared, people are shitting their pants. That tends to coincide with a market bottom.
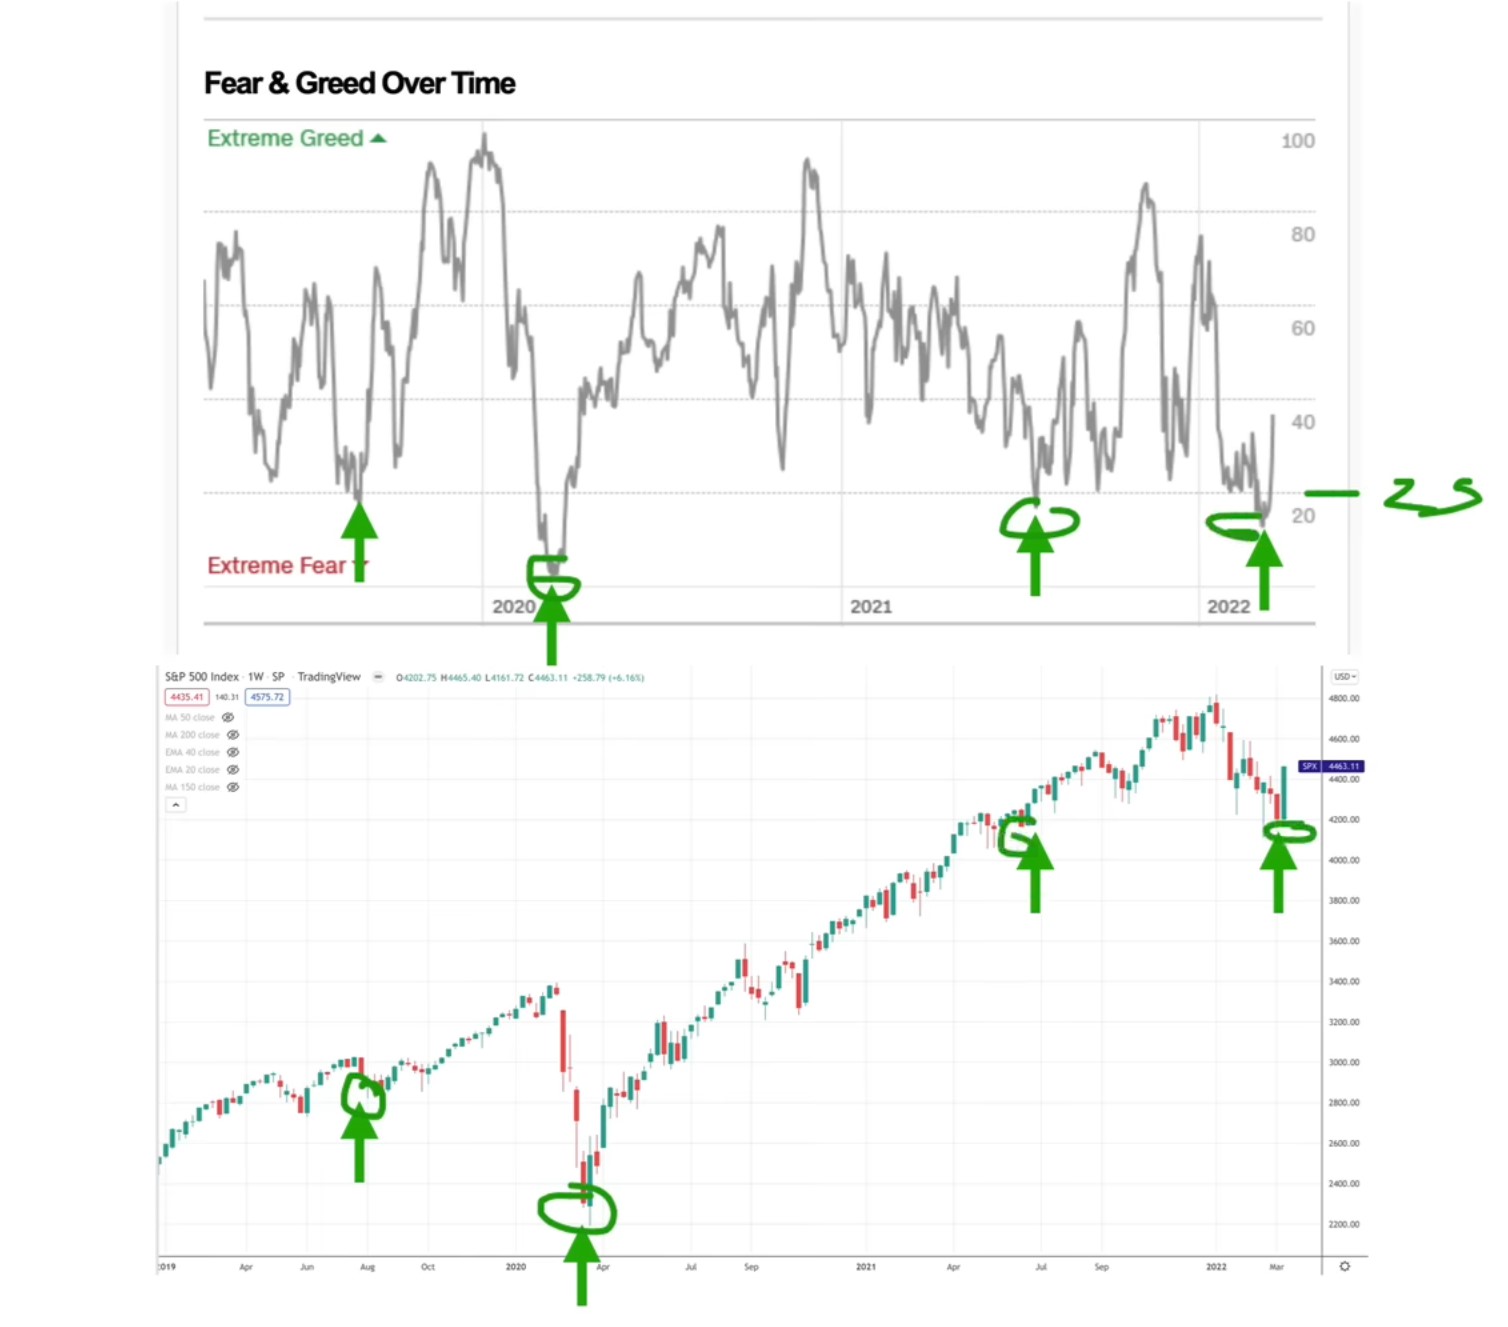
You can see here whenever we have got 'extreme fear' — which is below 25 on the index — the market tends to find a bottom. Right now we are close to 'extreme fear', so let's see how that goes.
The other thing that I'm looking at is the VIX.
The VIX is the volatility index, or the fear index, and you can see every time this sucker gets above 35, that means that there's extreme fear. Again that tends to coincide with a market bottom.
Will This Be A Protracted Bear Market?
Now some people have asked me whether it is possible that this S&P 500 goes into a bear market, whether we'd get a really bad recession, and whether this bear market could be as bad as 2008 or the year 2000 when the bear market lasted for about 2 years and took 3 years to go back up.
Is that possible? Well, everything is possible, but I still don't see that happening. I don't see a protracted recession or bear market like in the years 2008 or 2000.
Some people are saying "Hey what if this is actually the beginning of this long crash?"
So why don't I see that? Because remember that in 2008-2009 there was a lot of systemic risk in the market where the banks almost went bankrupt. They were holding all these assets that went to zero — these mortgage-backed securities. Millions of people lost their jobs, all right.
We don't have that here.
We have got unemployment at a historic low. We have got wages going up, people are employed, banks are well-capitalized, consumer balance sheets are strong — we don't have that systemic risk.
During the dot-com crash when many of the tech stocks at that time were not making money, but if you look at the companies that have dropped so much like Amazon, Facebook, Tesla, or even Microsoft, they are making money. They are making a lot of money, so it's a very different situation.
Of course, we could have systemic risk if Putin goes nuclear.
I mean if there's Nuclear WORLD WAR 3, that could really create systemic risk. But unless that happens, right now there's no major systemic risk in the markets.
Now some people say "But Adam, you know we just had an announcement that GDP came in negative," and everyone was shocked that GDP was negative. As you know, a recession is defined as 2 quarters of negative GDP growth.
We just had the 1st quarter where GDP for the 1ST quarter of this year fell 1.4%, so does this mean that we're halfway into a recession?
Maybe. We could have a technical recession.
A technical recession is a recession where it's very short and sharp, and even if we do get a bear market it'll be one that's a pretty fast bear market, not like a protracted '08, '09, '00.
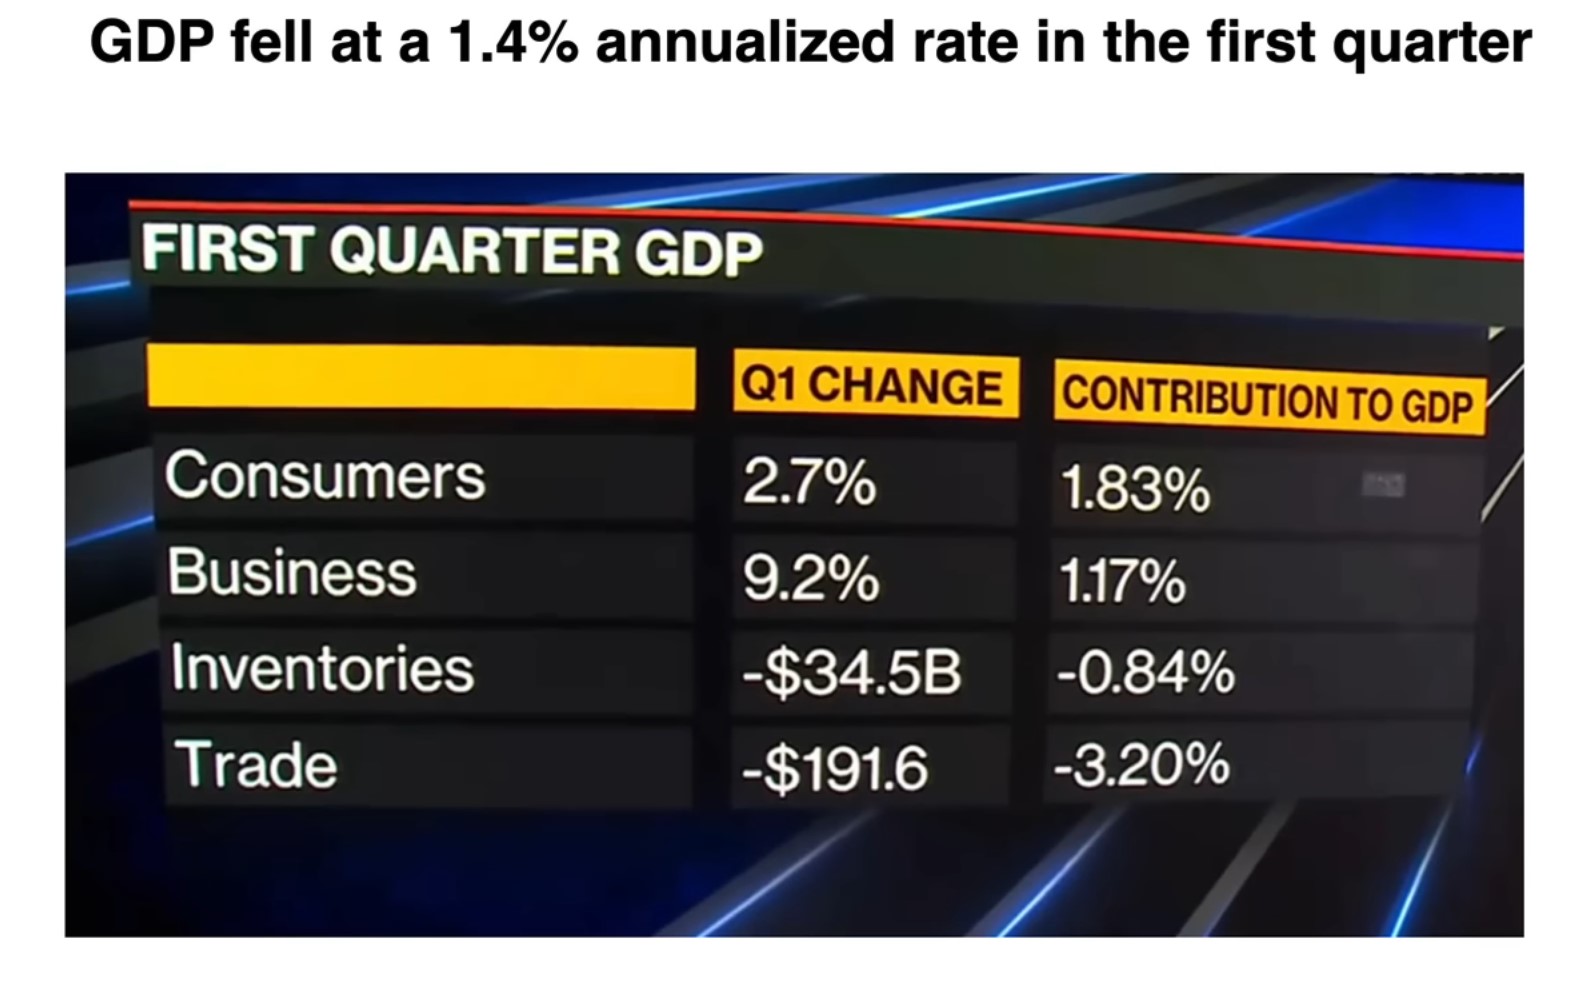
If you actually break down this 1st quarter GDP decline, there's some silver lining behind it.
Normally one of the biggest contributions to GDP growth in the U.S. is consumer spending. That's the most important part of GDP, and the good thing is that consumer spending was actually up. Although it was lower than expected, consumer spending still rose 2.7%. Business spending also rose 9.2%, so the only thing that caused GDP to drop in the 1st quarter was trade.
Trade was a -$191.6. Now, this is a technical reason why this happened: Understand how they calculate this. When the U.S. imports things, it's a negative to trade. When they export, it's a positive. So in quarter 1, there were more imports than exports, so there's this trade deficit that causes negative.
Why did this happen?
Because in November and December last year, there were a lot of imports that were supposed to come in, but the ships were stuck along the coast of California. They couldn't dock because of Covid restrictions and all those things.
But now the ships can come in, they're unloading these imports, and they record the imports in quarter 1 this year — causing a surge of imports in quarter 1 — hence causing the trade deficit — causing trade to deduct 3.2 percent from GDP.
The 2nd reason is because of inventories.
There's a drop in inventories of -0.84% to GDP. The reason is that initially there was a lack of inventory, and then what businesses did last year was that they built up their inventory stock. Now that their stocks are full, and they've got enough inventory to meet demand, they don't need to build inventory anymore.
So inventories are kind of like declining, and that's why you've got that negative spin to GDP.
So in other words, the GDP number is not as bad as it looks if you actually go below the surface of why that has happened.
About The China Markets. . .
Now interestingly in the last week or 2, everything came down, right.
Bonds went down, in the U.S. where every bloody thing went down, crypto went down (something that I don't touch), and everything went down.
The only thing that went up was China, so I'm not surprised that this year China could actually be the best performing market in the world. Maybe, I don't know right.
So some good news for those of you holding Chinese equities like me. I have got a 12% allocation right now.
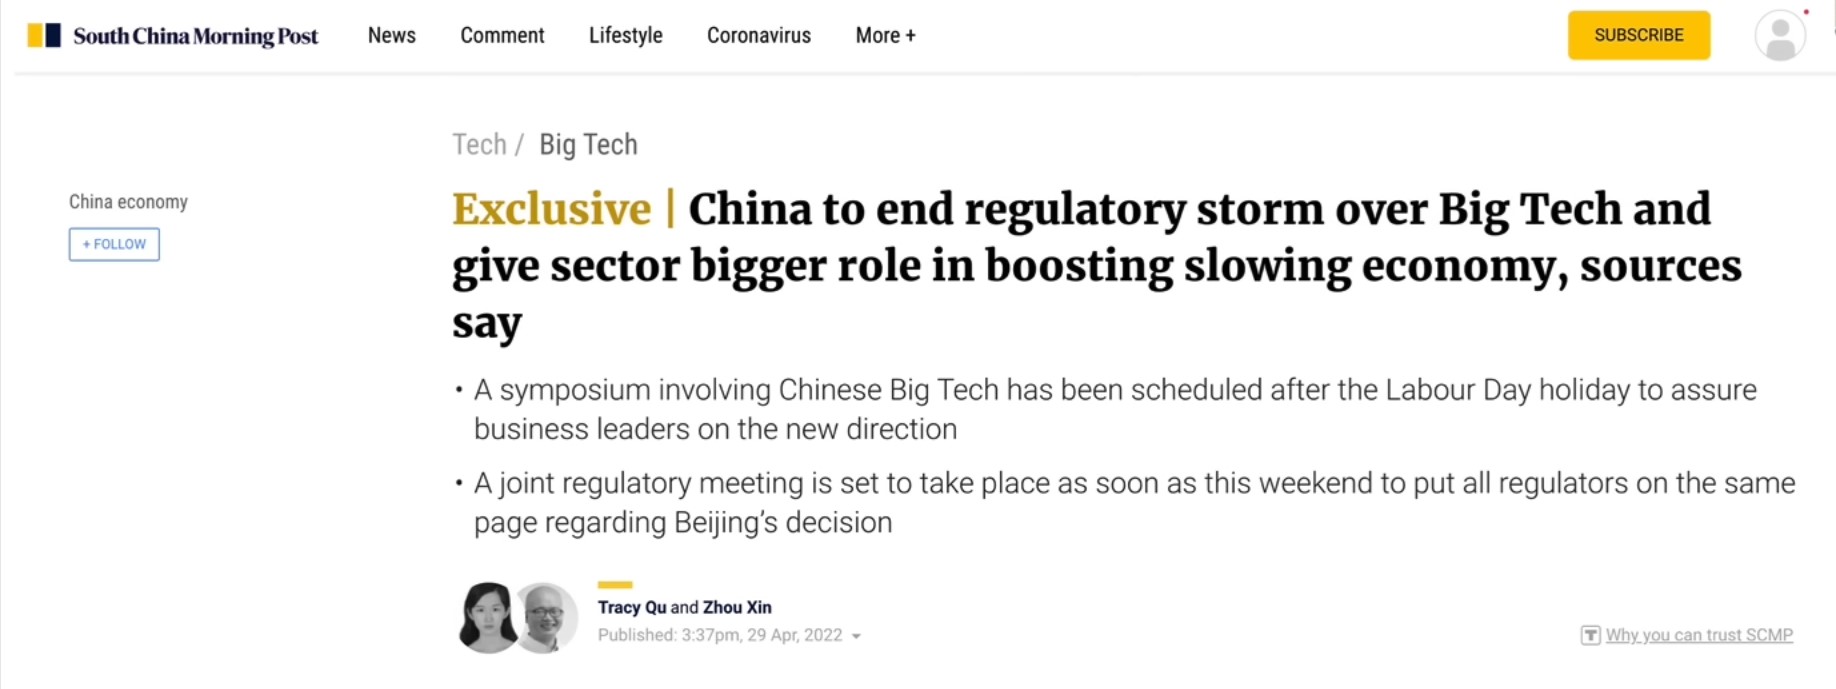
China is now saying that they are going to end their regulatory crackdown on the technology companies, and they are now telling the big tech companies that they're not gonna screw them anymore. They're gonna let them grow, and they need their help to grow the Chinese economy because right now it's in a sluggish position.
The Chinese government is now doing its best to stimulate the economy — spending on infrastructure spending, and because of that, Chinese stocks had a huge rally in the last week.
So Alibaba, Tencent, and Meituan went up 12%-15%.
So some people are skeptical about whether or not they can sustain it. I think it could, and I think that the lows of the China markets are in. I don't think we're going lower anymore. I think it's a matter of consolidating, and from here there's going to be a lot of upside for Chinese equities.
So this has been our monthly market review and analysis, and I'll see you guys soon.
May the markets be with you.
If you're keen on learning how to invest like I do, then consider taking up my WHALE INVESTOR™ Course. You'll learn all you need to start investing on your own, and you'll also be guided by my VALUE MOMENTUM INVESTING™ Strategy throughout your entire investing journey


submit your comment