Man. . . when is this correction ever going to end?
I think a lot of newbies are having this feeling that this stock correction is going on forever and day by day, they are losing faith because it seems that prices just keep going down.
They're thinking "Every time I buy the dip, it keeps going lower and I keep losing more and more money!"
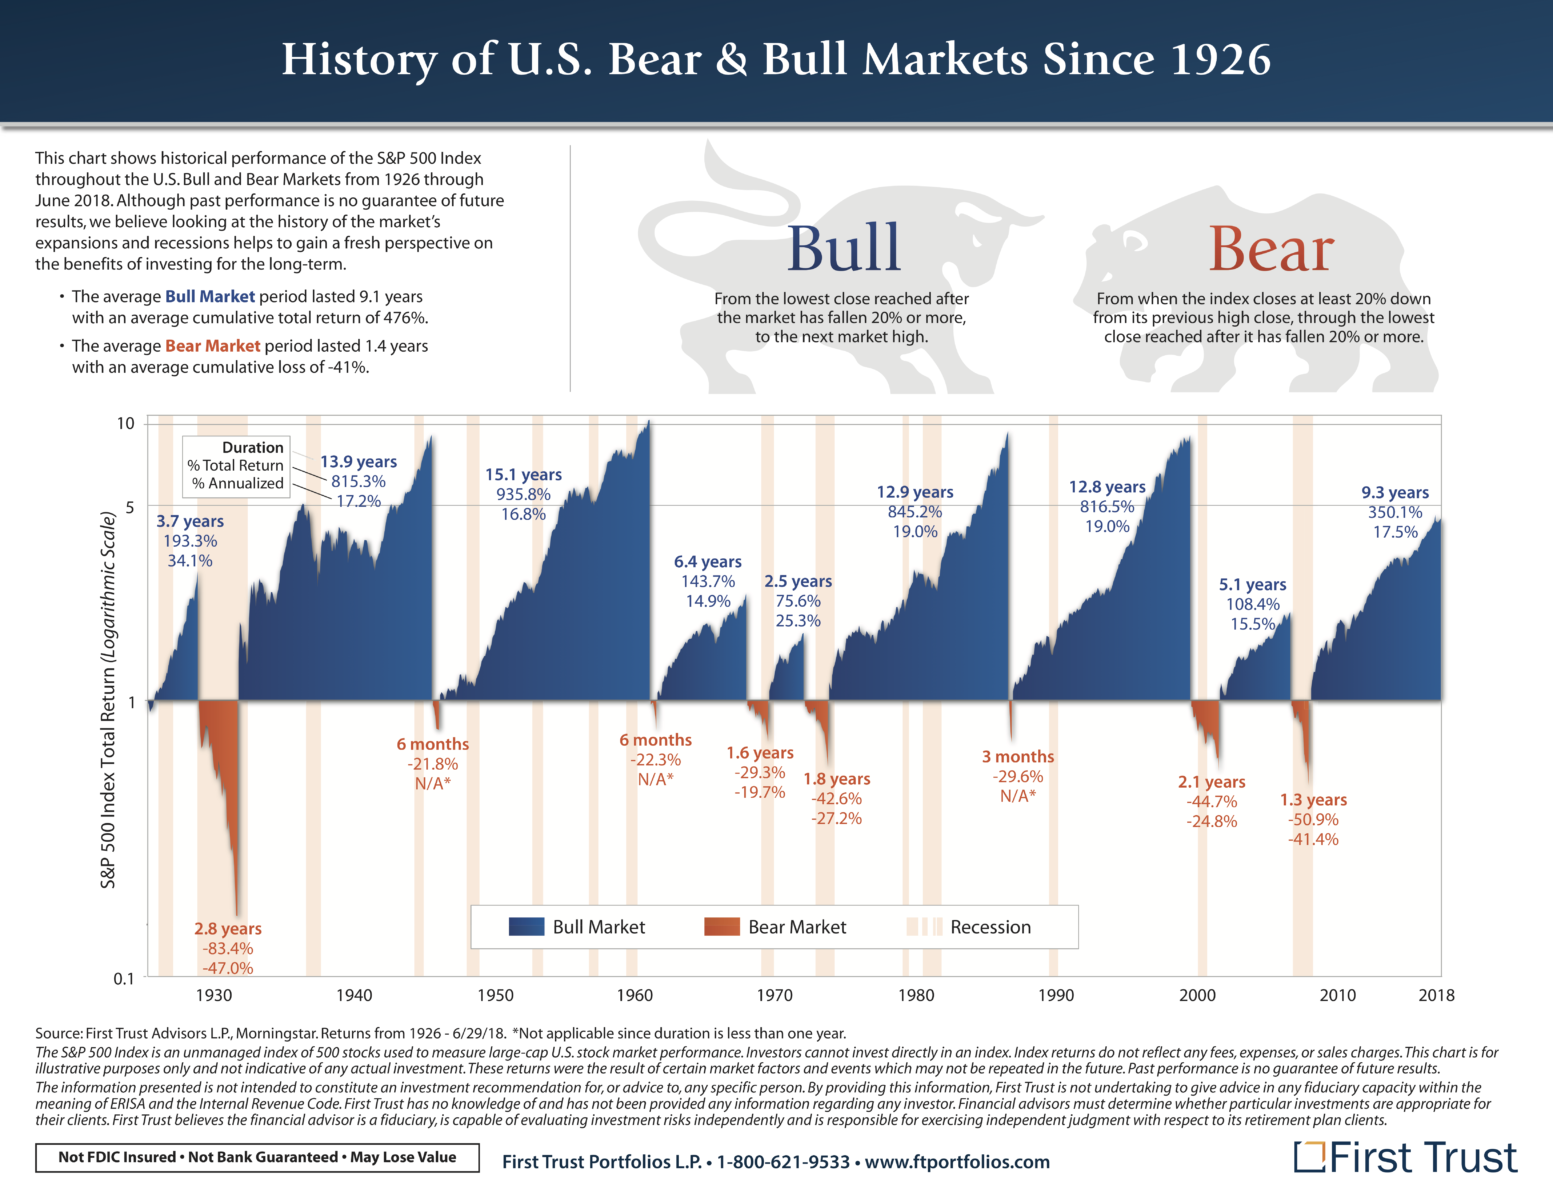
It's very common for new investors to think that way and forget that if you look at history, the market is in a BULL MARKET 90% of the time, and we are in a Correctional BEAR MARKET 10% of the time.
It's easy to forget because it's not too long ago we were in a bull market, and people have this recency effect where during the bull market, they forget about corrections — they forget about bear markets and they think the market is always going to go up.
Similarly, when we're in a correction and prices keep going down, we kind of forget that a bull market ever existed. People always think about what's happening recently and think that it's never gonna end, it's gonna keep going down.
Table Of Contents
Analyzing Past Corrections & Bear Markets
We MIGHT Be Close To The Bottom Of The Correction
The Main Catalyst For This Correction
Inflation Peaks Are An Ideal Time To Buy Stocks
What If The Markets Turn Bearish?
3 Conditions That Could Make Things Worse
What Do We Do As Investors & Traders?
The Only Time An Investor Should Sell!
A Simple Technique That You Can Use
Now I can tell you that after studying the last 120 years of history of the U.S. markets and being in the markets myself for the last 30 years, is that every correction will end.
It will always end, and after every correction, the market will then go back up to all-time highs!
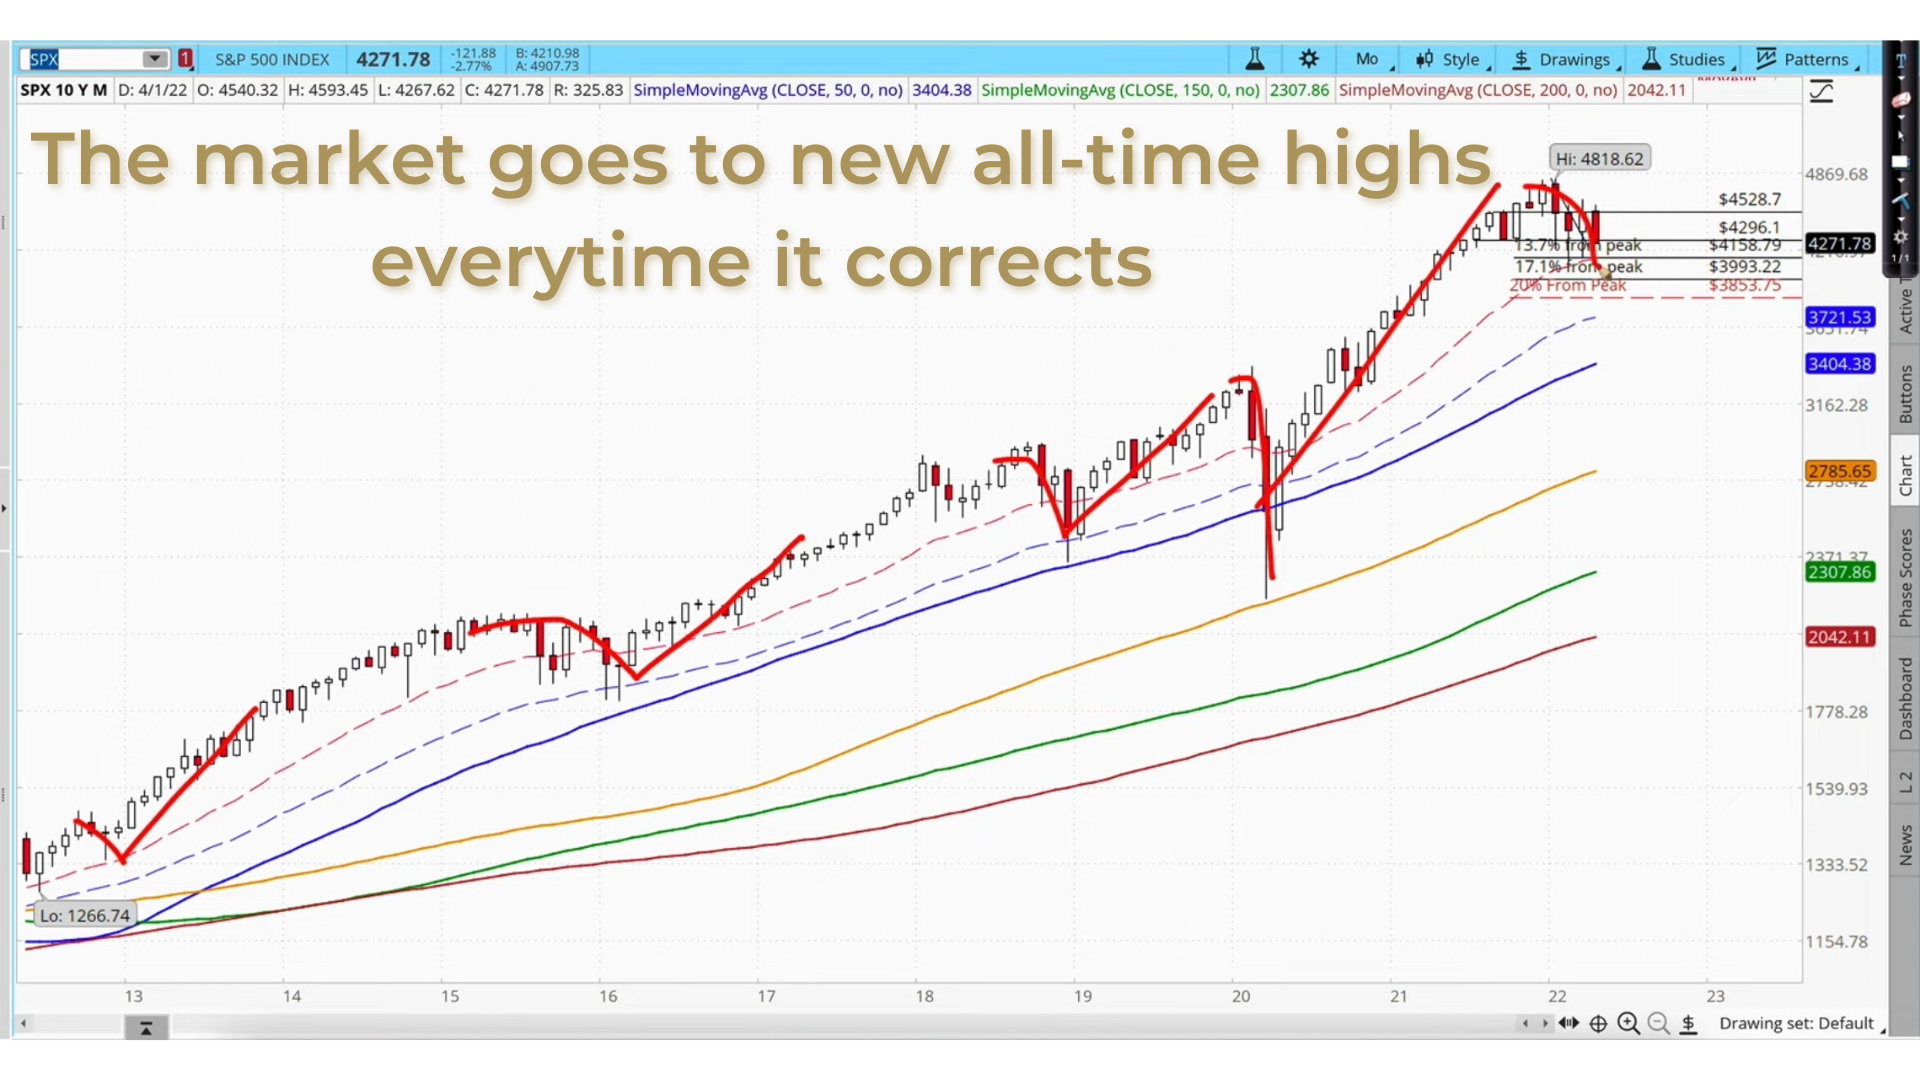
This is just from the last 10 years. After every correction, the market then goes to a new all-time
high.
And now, it's no different.
The only concern we have is how long is this correction going to take— how much closer are we to the
bottom before we then go to new all-time highs?
Analyzing Past Corrections & Bear Markets
So let's take a look at history and make some intelligent guesses about how long this correction is going to last.
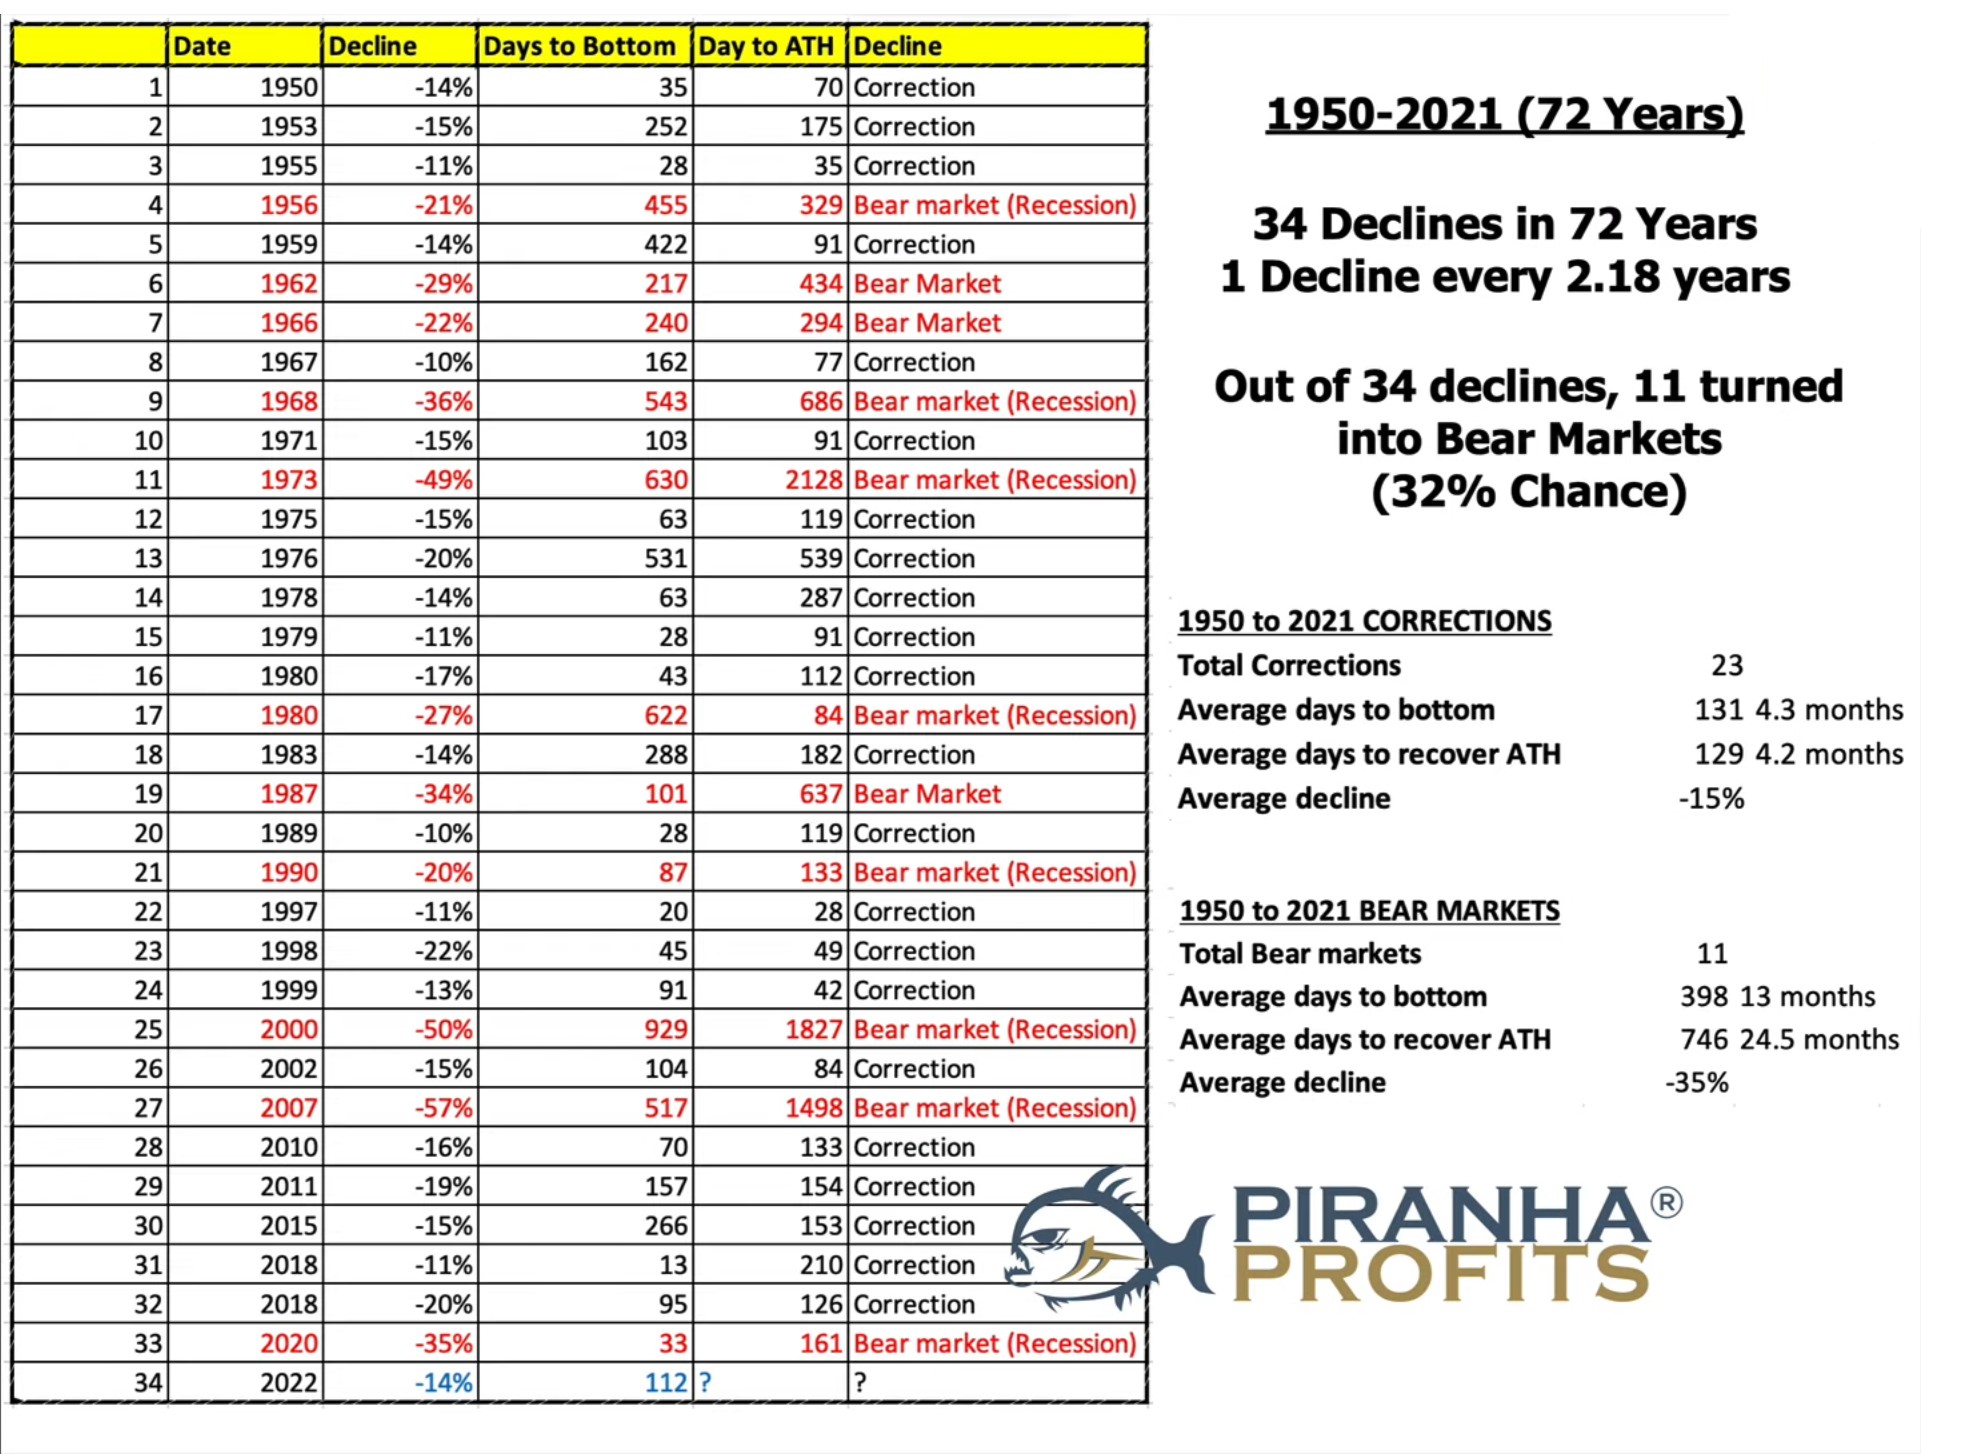
From 1950 to 2021, there have been altogether 34 declines in that time.
A decline would be either a correction or a bear market.
- A correction is when the market drops more than 10%, up to 20%.
- A bear market is when the market closes below 20%, and goes way below 20%.
So that's the difference.
Roughly, we have got a decline every 2 years. The last decline — which was a bear market — was in 2020. There was no decline of more than 10% in 2021, but now in 2022, we have a decline of more than 10%. So it's right on cue. If you think about it, it's kind of due this year that we would have that decline of once in 2 years.
Now out of the 34 declines, 11 of them turned into a bear market.
So people ask me, "Adam, what's the chance of us going to a bear market?"
Well, based on historical statistics, there is a 32% chance.
If we take a look at all the corrections in the last 72 years, there were altogether 23 corrections — they are the ones in black — 14% correction, 15%, 11%, 14%, 10%, and so on.
So for the 23 corrections, how long did it take to reach the bottom?
If you calculate the average, it takes an average of 131 days (~4.3 months) for a correction to reach the bottom.
How long does it take from the bottom of the correction to get back to a new high?
Well again if you calculate the average, you get about 129 days (~4.2 months). Interestingly for corrections, it takes roughly the same time to get back to the all-time highs as it took to reach the bottom, and for corrections, the average decline is 15%.
We MIGHT Be Close To The Bottom Of The Correction
So this current correction that we are going through, so far the decline to the bottom has been 14% on the S&P 500 — which means that we are now only 1% away from the average.
So that's a clue that we COULD be near the bottom, and so far, from the time the correction started, it's been over 112 days. Again, the average to the bottom is 131 days, so looks like we have got about 20 days to go to the average bottom.
So if this happens to be a usual correction, then we could possibly bottom pretty soon.
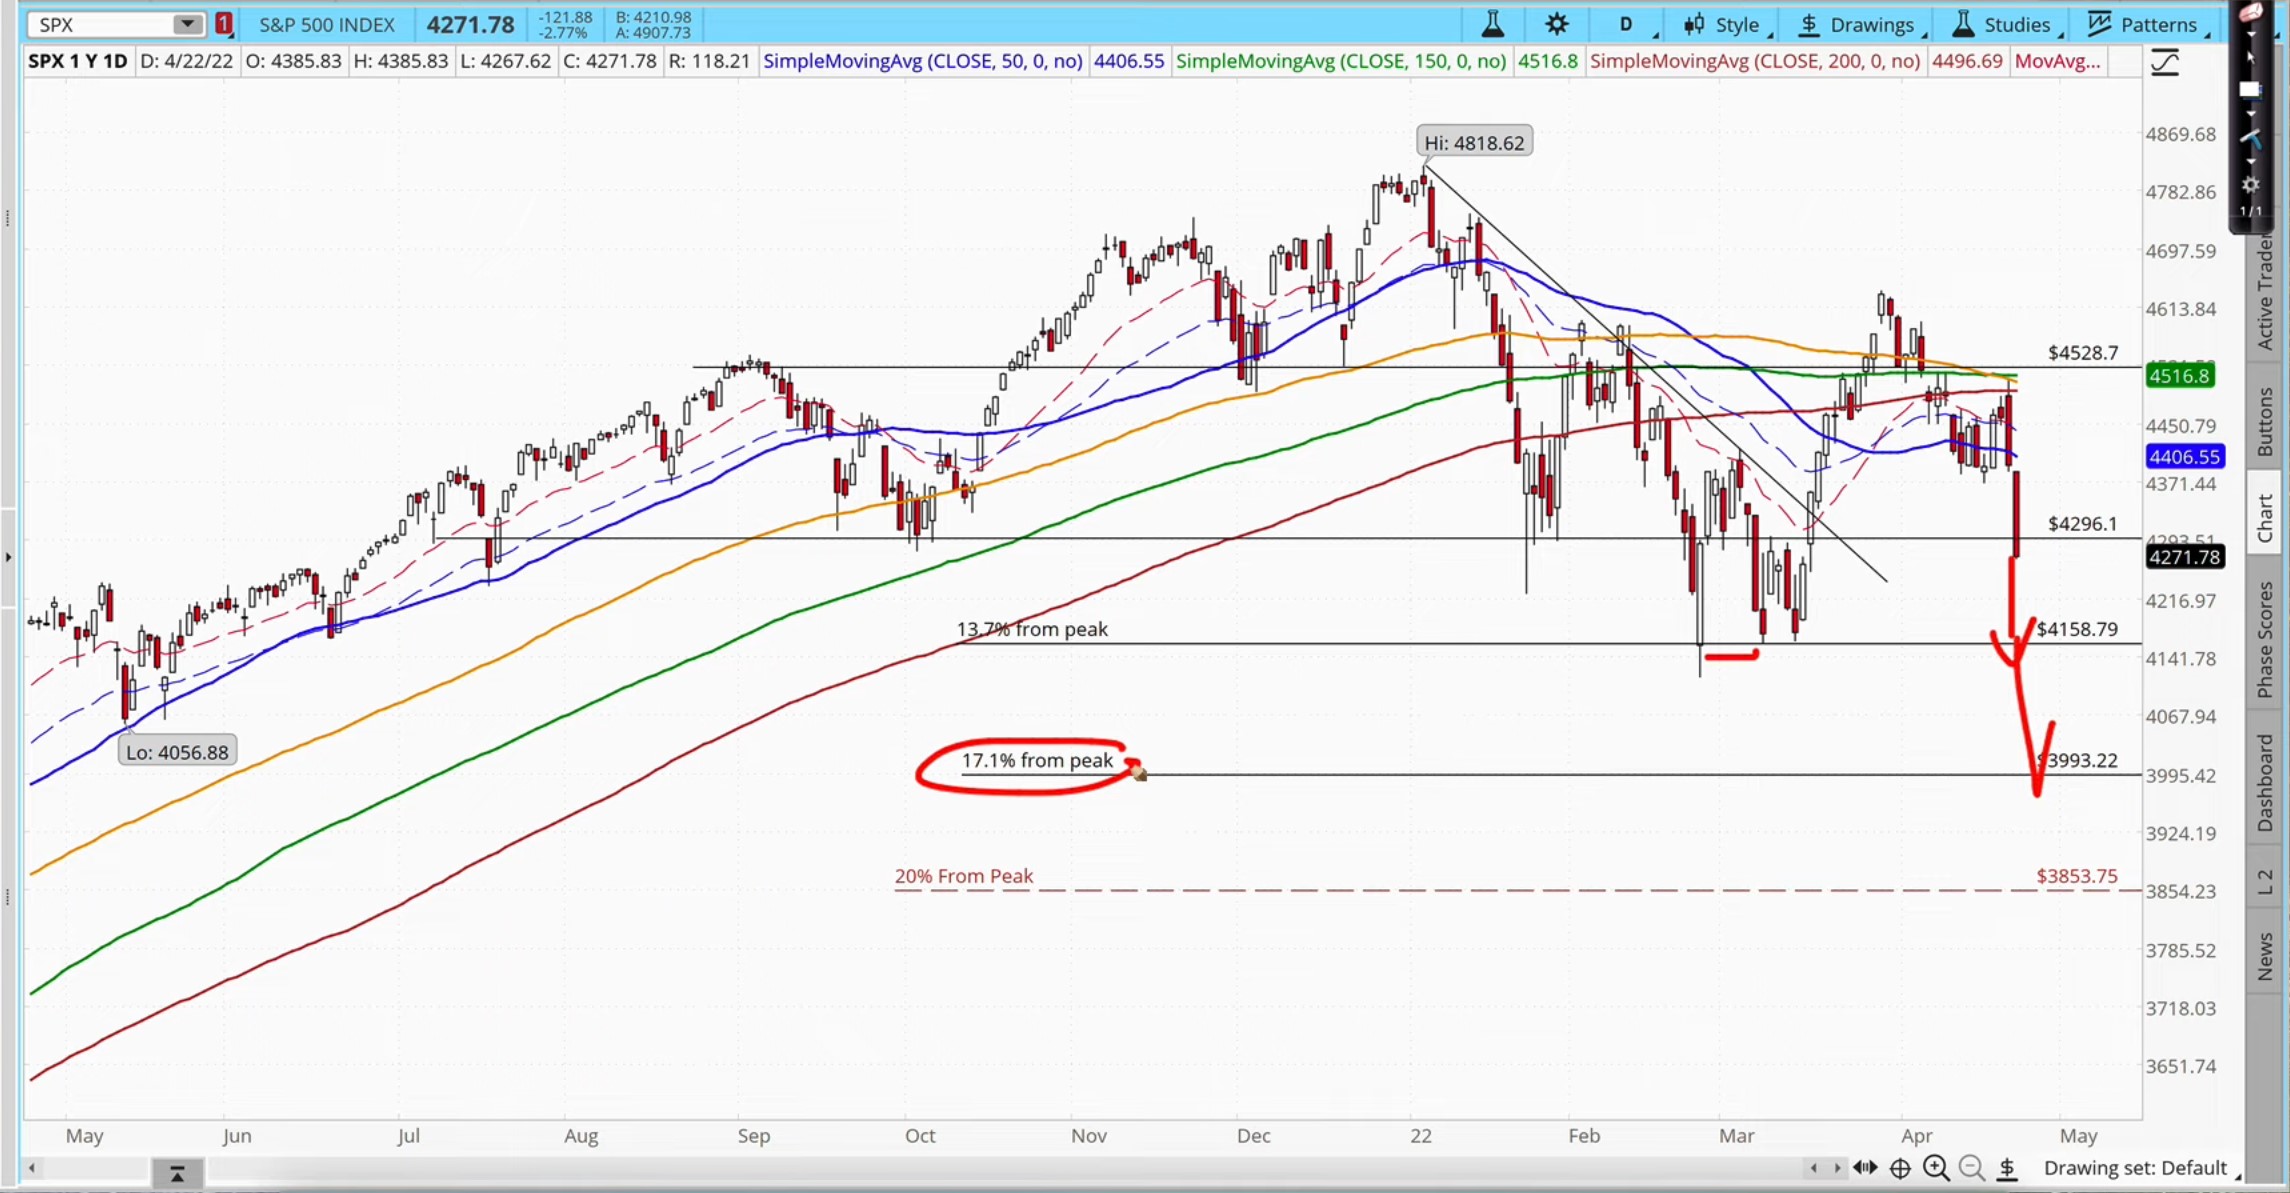
Looking at the price action, you can see that it looked like late February/early March was the bottom, thereafter the market went up and broke out of that Moving Averages resistance, but it couldn't sustain it.
The market came back down again and now based on the price action, it looks like we could be going back down to retest this recent low, or we could even go all the way down to 17% — and I drew this early this year because based on studies of previous U.S. Midterm Election Cycles, the markets tended to correct up to 17% during those years.
So again, we could be retesting the 13.7% level or the 17.1% level before we bottom and before the market starts going back up again.
The Main Catalyst For This Correction
The main catalyst for this stock market correction is the FED having to raise interest rates aggressively and tighten financial conditions in order to control sky-high inflation which is now 8.5%.
So if inflation can peak and begin to come down, the FED may not have to raise rates as aggressively as they project.
So in other words — the key to the market bottoming would be if inflation begins to come back down.
Is there a chance of that happening really soon? Well, according to legendary pattern trader Larry Williams, who's been in the markets longer than I've been born, YES!
I highly recommend you watch his latest presentation on youtube. Larry Williams has been forecasting inflation cycles, and they have been pretty accurate over the years.
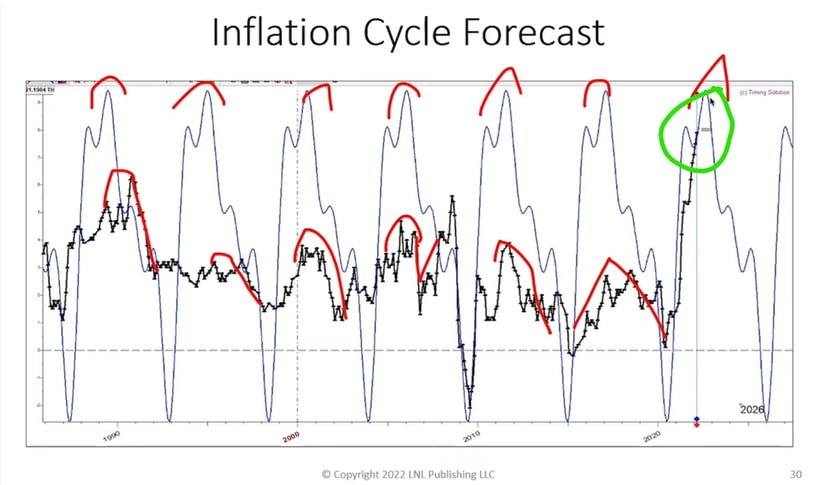
This is from 1985 to the current year right now, and you can look at this inflation cycle. This is the cycle pattern and you can see this is the actual inflation. So it kind of like peaks then comes down, peaks then comes down. It's not exact but it's pretty spot-on at times.
On the furthest right is where we are right now, and it is currently near the inflation cycle peak which is roughly in the late 2nd quarter of this year — which will probably be in late June or early July we'll start to see inflation peak and come back down again.
Inflation Peaks Are An Ideal Time To Buy Stocks
Again, once inflation comes down that would be EXTREMELY BULLISH for the markets. In fact, again if you take a look at Larry's research, he has shown that inflation peaks have been the ideal time to buy stocks. Whenever inflation peaks and starts to turn down, that's a great time to buy stocks.
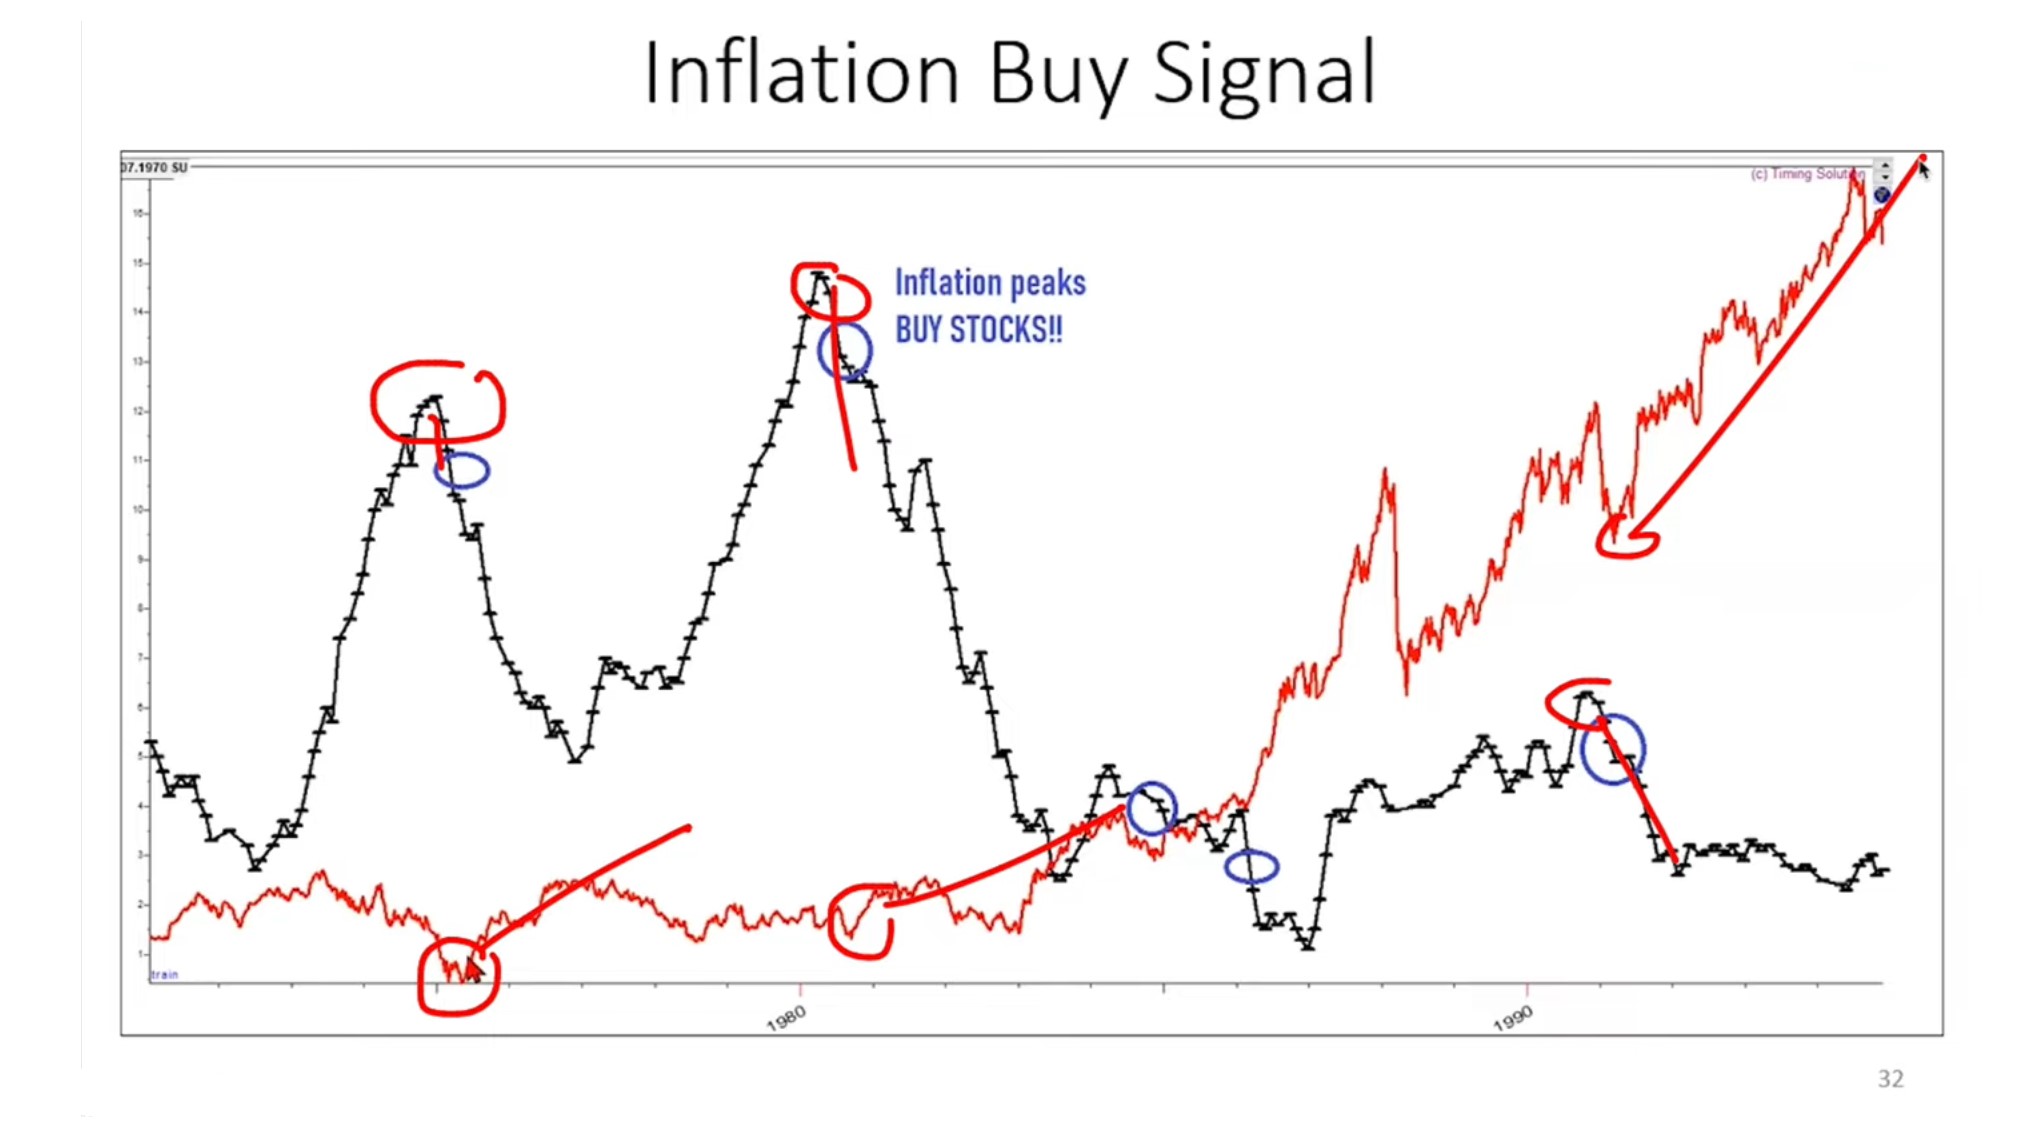
Right now, inflation is 8.5%, it is near its peak and will start to come down in the next month or so, which would be a great time for the markets to bottom. This is very much in sync with what I've shown — that corrections tend to bottom in their 4th month and after about a 15% average drop in the markets. But we'll see how it goes.
Again, recommend that you can watch Larry Williams' full video on youtube titled "Is it Time to Get Bearish?"
What If The Markets Turn Bearish?
Some people are saying, "But Adam, what if this is not just a correction? What if this turns into a bear market— the 32 percent chance you're talking about. Then could we go a lot lower?"
The answer is YES, we could.
So if you take a look at the history of bear markets again, bear markets happened 11 times in 72 years. so on average, it happens once every 5.6 years, and we just had one in 2020. Most of the bear markets are accompanied by a recession — but not all of them. Some of them had no recession and they were relatively smaller bear markets, but if you take a look at all the bear markets you can see that the average time it took to hit the bottom of a bear market was 398 days, which is about 1 year.
For bear markets, it takes longer to recover back to the all-time highs. In fact, after an average bear market, it takes 746 days to get back to the top — about 24 months or 2 years.
So for bear markets, it takes double the time to get back up than the time it took to drop down, and
the average decline of a bear market is 35%.
So if you've been watching the media, a lot of people are saying that "A recession is coming so it's gonna be a bear market and this is what we're gonna experience!"
So do I think so? I still don't think so. I mean it could happen, but I doubt it.
Why? Let me show you some numbers on the probability of a recession.
Probability Of A Recession
Now it depends on who you ask.
First of all, understand that it's almost impossible to predict when a recession is going to come. In fact, if you look at all the previous recessions, no one could predict it accurately, and recessions tend to happen due to things that most people never expect.
Who could have expected the Covid-19 pandemic right?
So anyway if you take a look at a recent survey of economists by the Wall Street Journal, most of them on average predict a probability of recession at 28% in the next 12 months.
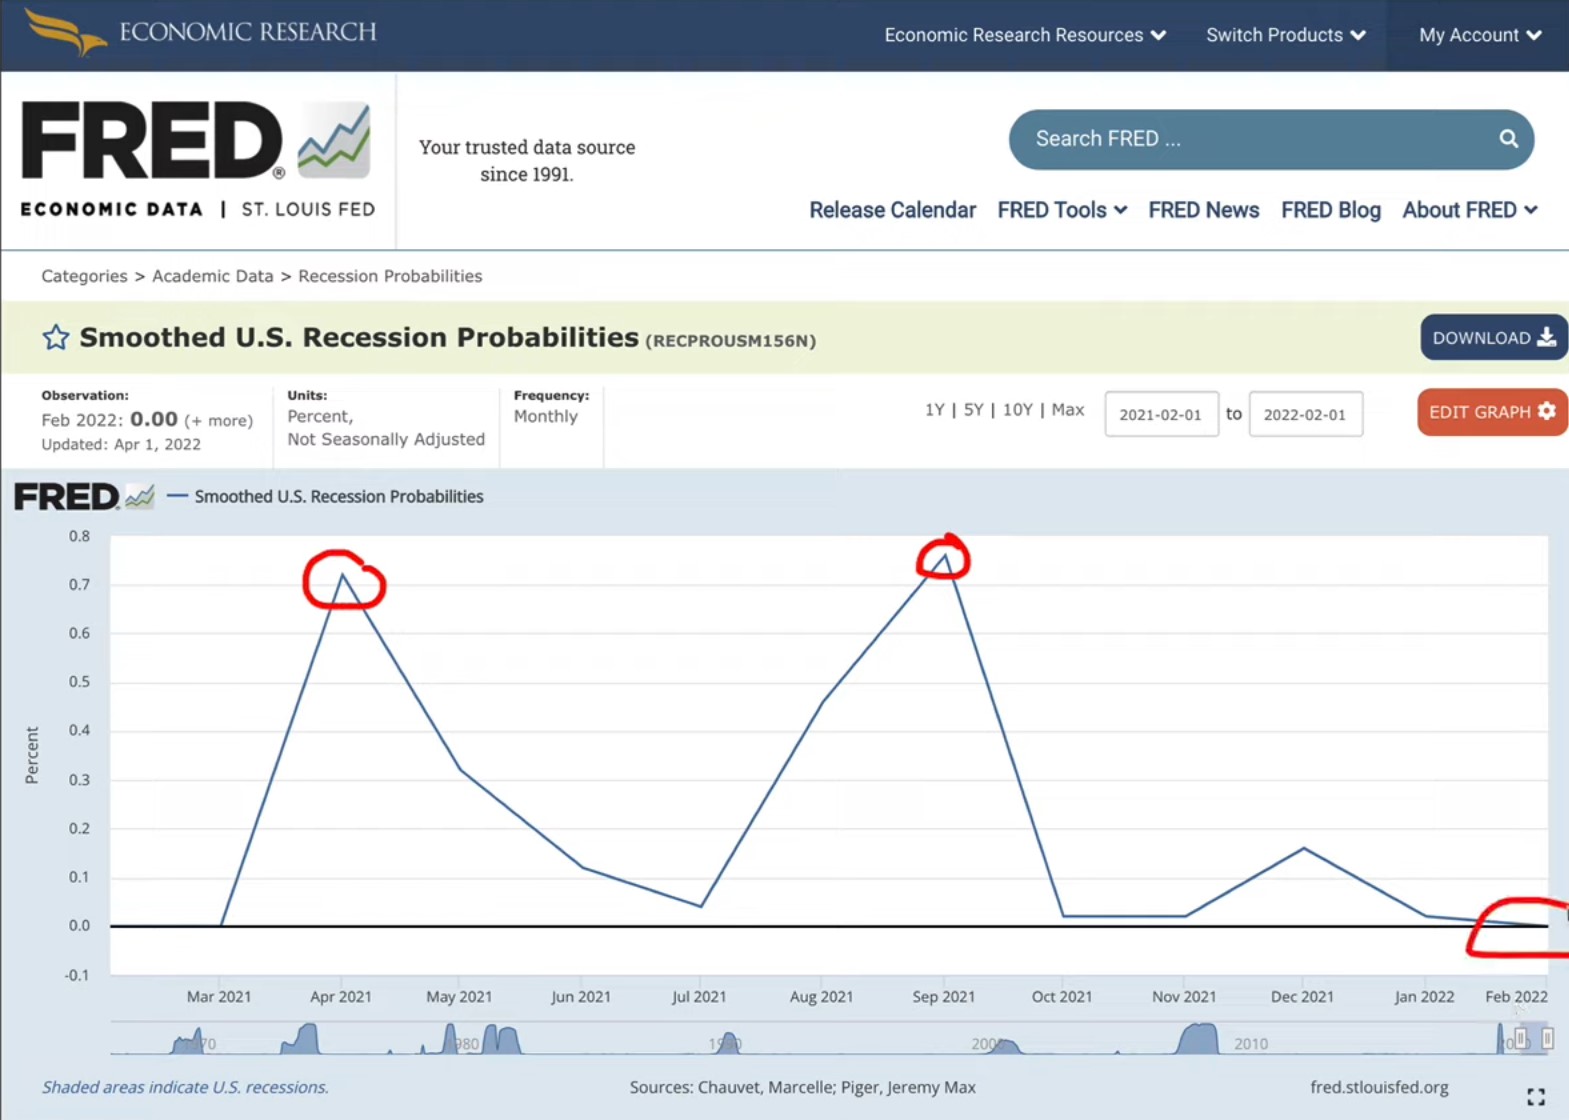
But what does the Federal Reserve themselves say?
You can go to their website, and they actually have a chart that shows you the probabilities of U.S. recessions. You can go back to the last 50-100 years to take a look at this probability chart.
This probability chart is based on 5 monthly coincident variables:
- Non-farm payrolls
- The index of industrial production
- Real personal income
- Real manufacturing and trade sales
What they found is this:
Over the last 52 years and over the last seven recessions, every time this probability passed 20%, there's been a recession.
So have we passed 20%? No, in fact, you can see in April 2021 the probability of a recession from the FED itself was 0.7%. in august or September 2021 it went up 2.8%, and the latest in February 2022, the
probability is near 0%.
So based on the FED research, it doesn't look like there's going to be a recession.
The U.S. economy is still really strong — wages are rising, unemployment is still going down, and at the same time, household balance sheets are still very strong with a lot of savings, in fact, higher than pre-pandemic levels. So I don't see the same kind of systemic risk that we had back in 2008 during the financial crisis or back in the year 2000 — the Dot-Com Crash — where a lot of tech stocks were losing money. I don't see that scenario right now.
I see the U.S. economy is still really strong, I see the U.S. market as not that crazily expensive. In fact, quite a number of companies I mentioned are undervalued.
So even if we do get a bear market, I don't see a big bear market happening; it could be just a short bear market and not a recessionary kind like in the 2008 & 2000 bear markets.
3 Conditions That Could Make Things Worse
Of course, things can get worse under 3 conditions.
The 1st is if oil prices go up like crazy and that triggers a global depression. . . but that's not happening. In fact, now, oil prices are coming back down so that's not a worry anymore.
The 2nd worry is of course if Putin goes nuclear. I mean if that guy goes nuclear, that could really set off a global problem.
The 3rd issue right now is the U.S. housing market. It has gone crazy — it's up more than 50%-60% in the last 1 year and it could be now in a second Bubble 2.0 and with long-term interest rates rising, mortgage rates now above 5%, it could go to 6% and that could cause the housing bubble to burst.
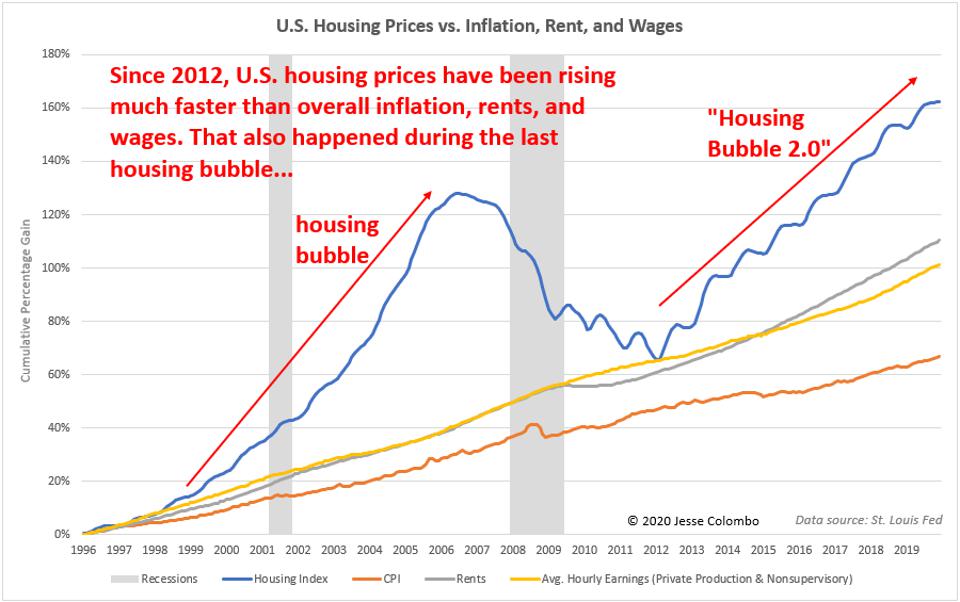
That could trigger a recession, but the good news is that a lot of homeowners, unlike in 2008, are not sub-prime owners. So lending has been a lot stricter so people have a greater ability to service the loans so there's like a less likelihood of default in the housing market.
So #2 & #3 are the two main concerns that I see that could jeopardize the entire market.
What Do We Do As Investors & Traders?
At the end of the day, the question is "What do we do as investors, what do we do as traders?"
Remember, no one can predict when the recession is going to come, or if it's going to come at all. No one can predict exactly where the market is going to go.
So as investors, what's the smart thing to do?
The thing to do is this: Whether you're an investor or trader, you have to stick to your plan, stay the
course and not halfway change or abandon your plan just because the markets are going down and you're freaking out.
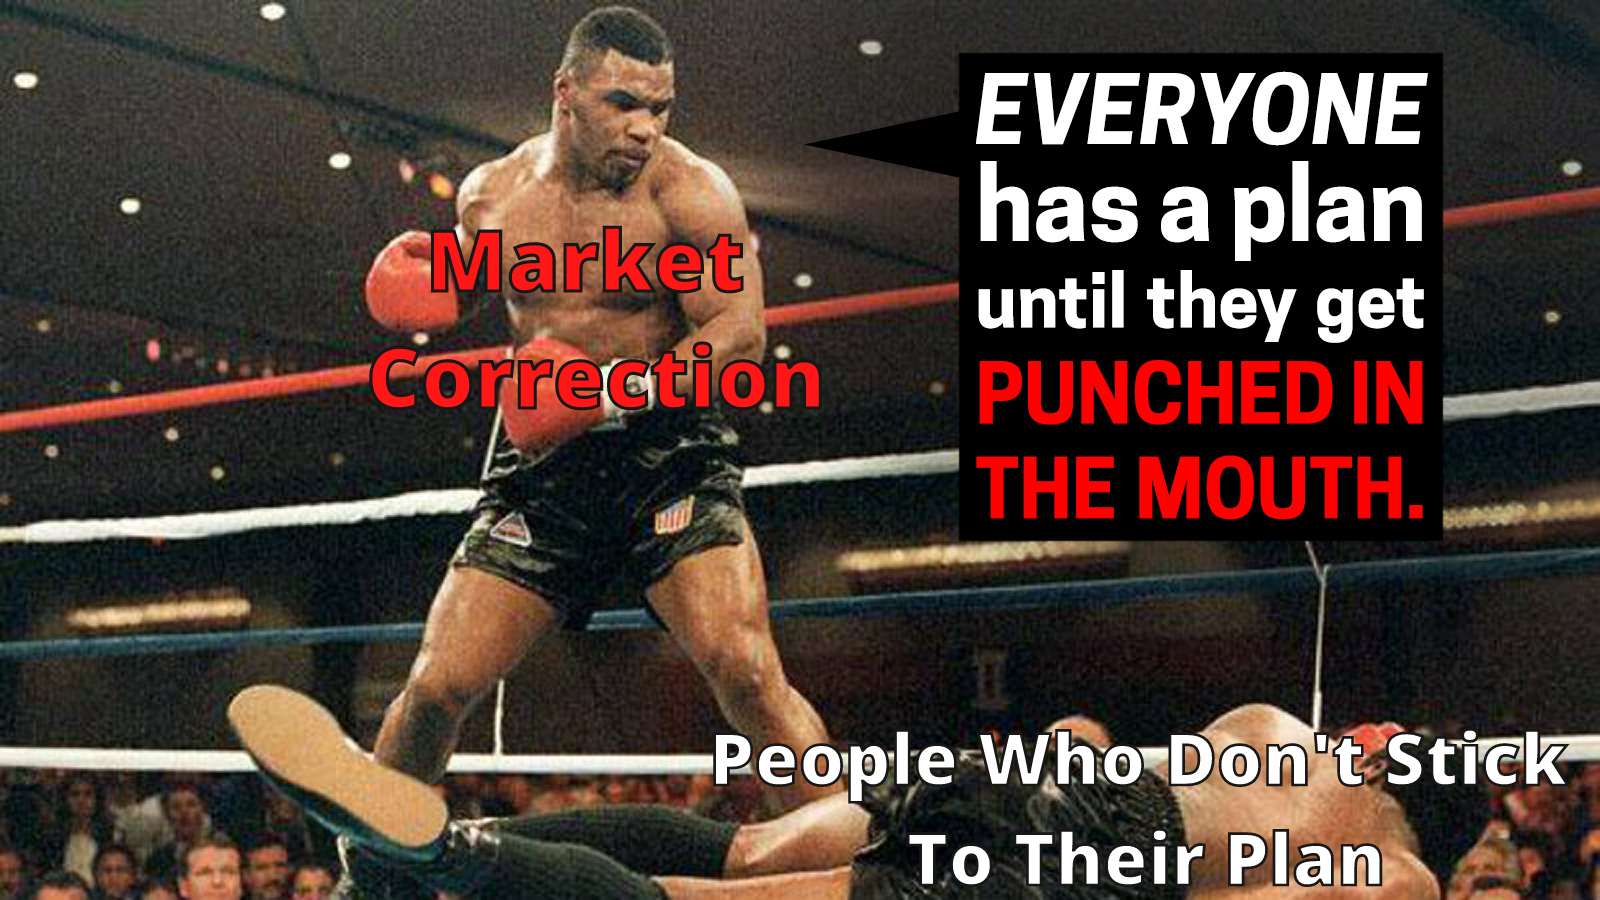
Mike Tyson famously once said "Everyone has a plan until they get punched in the mouth,"
And a lot of people now are getting punched in their mouth because the market's going down and they forget their plan. You've got to stick to your investment or trading plan.
For example, if your investment plan is to buy great companies when they're undervalued, stick to it, and keep buying great companies. There's no reason to sell if there's nothing wrong with the underlying business.
If you're a trader, when you enter a trade, there's always a stop-loss. Once your stop-loss is hit, just get out and enter a new trade when you see a clear trading setup.
The majority of the time, I'm an investor. So what am I doing? I'm sticking to my investment plan, I'm holding great companies that I know will go higher eventually. They may go down in the short term, but I ain't selling sh*t. I'm holding my companies, and in fact, I consistently keep buying when they hit new support levels.
DISCLAIMER: As you guys know I am using options to hedge my investments. I'm using options to short the market, so I make some short-term profits as the market goes down temporarily.
Selling VS Holding
A lot of newbies have this thinking "Hey you know what, what if it gets worse? What if the correction keeps going down? What if it's a bear market? I'm gonna sell before things get worse!"
In my opinion, that's the worst thing you can ever do. You'd never want to sell, especially if you're holding good businesses. I've said this many many times during all the past crashes.
Back in 2020 and in 2018 I said "DON'T SELL!" and sure enough, eventually when the markets came back, people said "Adam, thank god I didn't sell near the bottom," or "Thank god I didn't get out," because most of the time when you sell, you never get back in at a good price anymore. You may never get back in, or you'd get back in at a very high price and you miss out on the market.
So don't do anything that you regret 1 or 2 years from now.
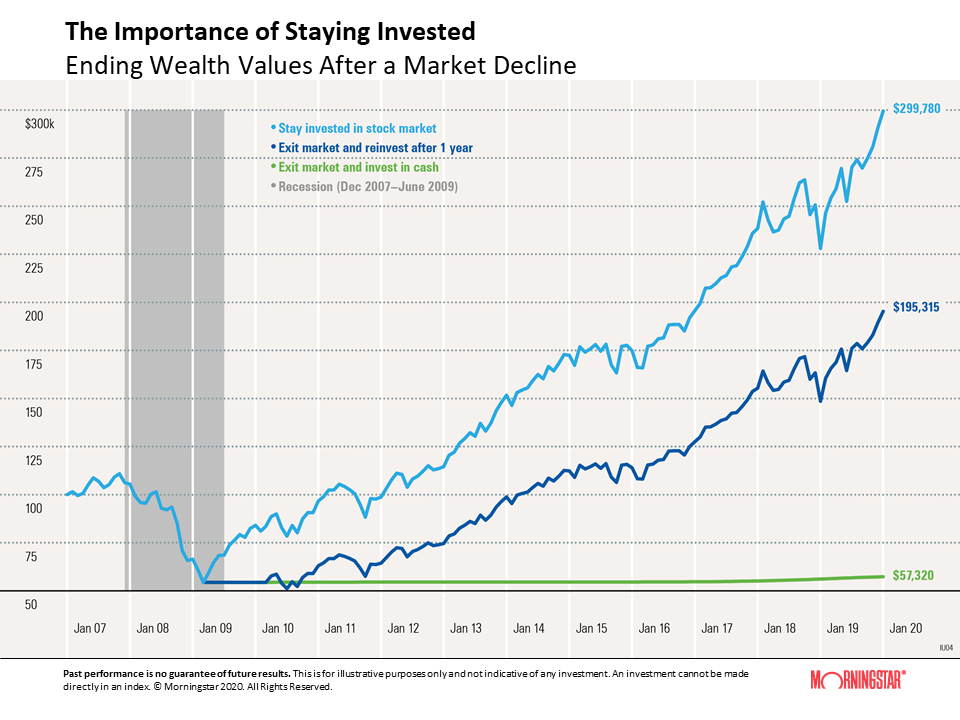
It's never been a good idea to sell stocks of good companies during corrections. If you take a look at this research by Morningstar, you can see that if you simply stay invested in the stock market through the ups and downs of corrections, this would be the outcome of your money growing. But if you get out of the market and get back in 1 year later, most of the time, you will get a lot less than just staying in the markets.
The worst thing that you can do is to exit the market and never get back in again, and just hold the cash in fear, because if you did that during the Financial Crisis the green line is what would have happened to your money years after the financial crisis. So you can see that this was one of the worst crises in U.S. history, but staying in the markets was always the best outcome.
Some people say "Hey Adam, could I kind of like sell now and buy back later at a better price?"
Who doesn't want to do that? That sounds like a great idea, but more often than not, you often get back in at a worse price, or you never get a chance to get back in at all.
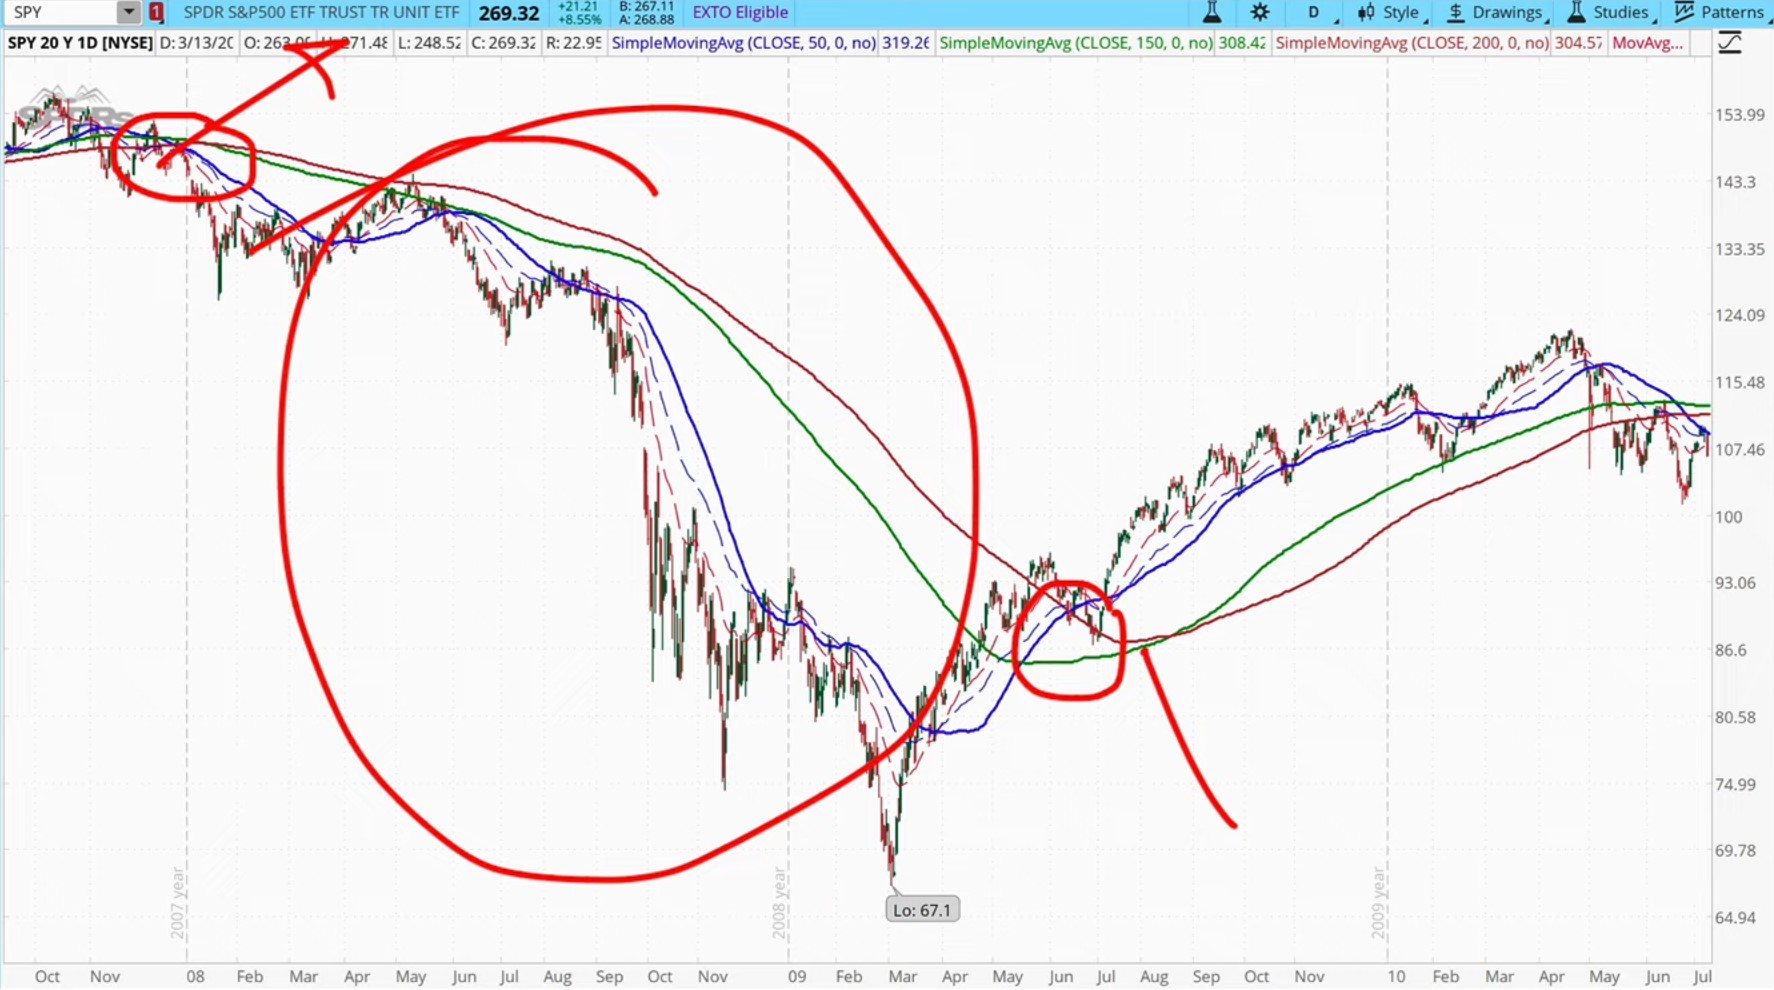
One way is to look at trends. You get out on a downtrend and you get back in on an uptrend. A lot of people use Moving Average crossovers; one of the most common ones is known as the 'Death Cross' where the 50 moving average crosses below the 200-day moving average.
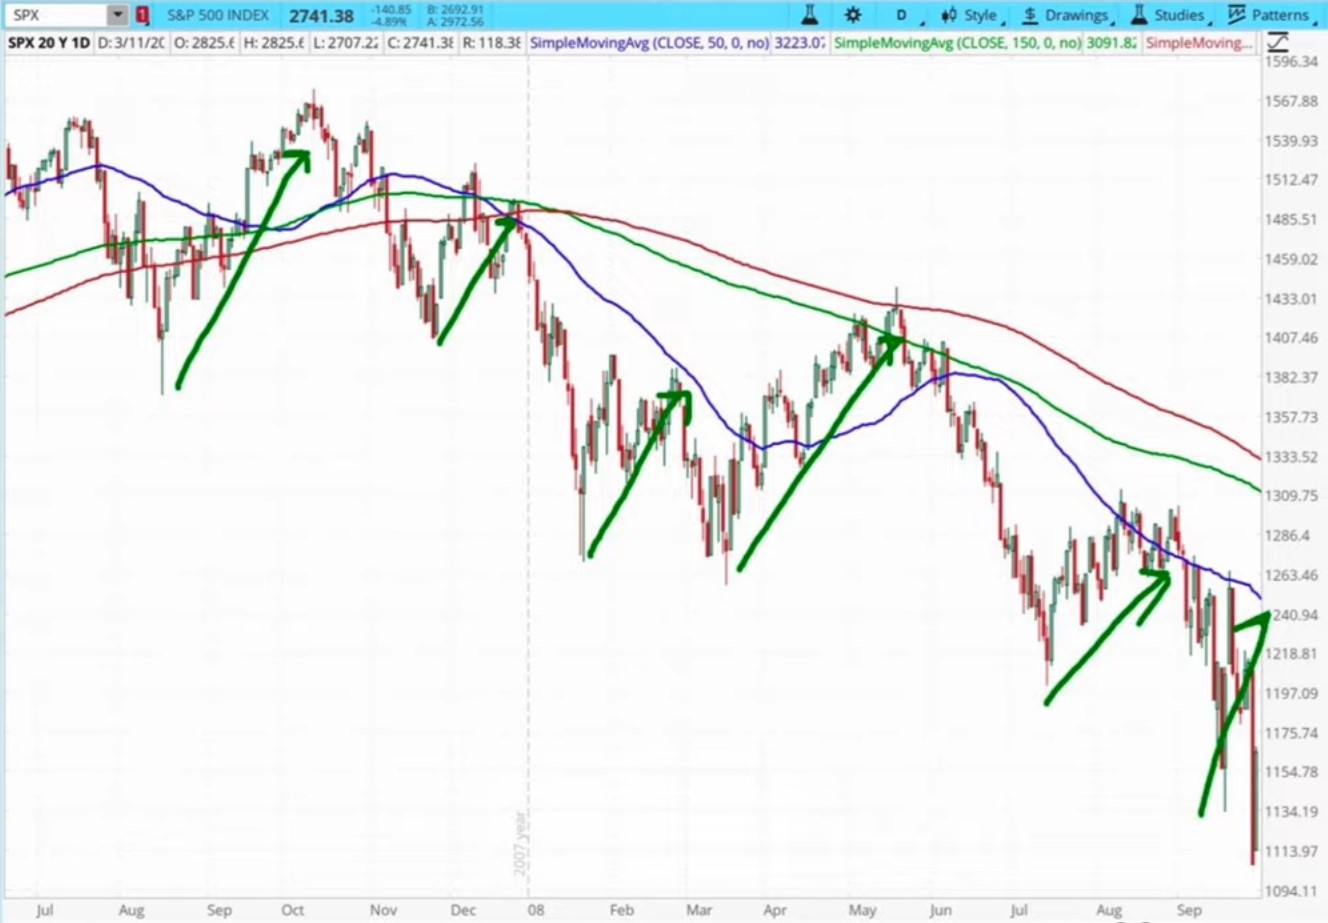
I look at the 50ma crossing below the 150ma, while some people look at the 50ma crossing back above the 200ma. At times, it does work really well, for example, during the Dot-Com Crash and the Financial Crisis, if you got out during the moving average crossover and got back in at the reversal of the trend, you would have avoided that big drop and you would have gotten out when the moving average crossed down and gotten back in when the moving averages crossed up.
It can work at times, but what I've noticed is that if you did this — get out and get back in again — out of the last 11 bear markets, you would have been better off in only 2 of them. 9 out of 11 times if you got out and got back in again, you would have been worse off. You would have got in at a much higher price. It's just the way it is.
In the past, I used to jump out of the markets on downtrends and jump back in on uptrends. I used to do that years ago, but I found that if I didn't do that — if I just stayed in the markets through the ups and downs — I would have actually made more money eventually.
That's something I've learned over 30 years of being in the markets.
The Only Time An Investor Should Sell!
You should sell stocks if:
1) You're holding low-quality stocks of companies that are losing money or stocks that are overvalued.
- Reinvest the cash into high-quality companies that are undervalued.
2) If you are over-leveraged
- If you've borrowed a lot of money on margin to buy stocks, I would get out if I were you, because if you don't get out and it goes into a bear market, you could get completely wiped out.
That's why I keep telling my students not to invest with borrowed money and only invest with money that they don't need to use for at least the next 3 to 5 years.
You'd have no worries, even if the market goes down in the short term. But if you need the money and you're forced to sell, that's the worst thing that can happen, because you'll be forced to get off the market thanks to margin calls, so you're not there anymore when the market rallies back up.
If you do want to get off the markets because of these reasons, then never sell the low.
Remember that on a downtrend, the market will not drop in a straight line down. It would drop then rally up again & again, so if you want to get out for whatever reason like this, wait for a rally up to get out.
The problem with most people is that they tend to sell at the bottom of a downtrend. When it drops they panic and they sell. The moment they sell it goes back up again. Then they go "SH*T!" and then they buy again, and it drops again, and they sell again.
They keep losing more and more money that way.
My Strategy
My strategy is this: I'm holding great companies I ain't selling. In fact, I'm just buying more. I'm buying only good companies — high-quality stocks (Wide Economic Moat, Consistent Sales, Earnings & Cash Flow, Conservative debt, Undervalued)
These are companies that will always go higher eventually, and a correction is a great time to accumulate shares of these stocks.
But again I'm always buying within my planned allocation.
I teach my students that in a portfolio, each stock should not have more than a 5% allocation. That's me being conservative, so the moment it hits 5% allocation, that's it. I don't buy anymore.
The key to buying is to never buy all at once.
For example — I really want to buy Apple. I sold Apple in the past, I made a lot of money, and I'm waiting to get back in but I'm not buying yet because it's not cheap enough yet. So eventually I would like to buy up to 5% of Apple in my portfolio.
Am I going to buy 5% at one go? No, I'm gonna buy 1% first and then another 1%. I always average in my positions.
One way to average in is to buy the moment the price hits support levels that you can identify, and I tend to use moving averages. If you look at Apple's long-term chart, you can see the very strong support level at the blue line — the 50 moving average.
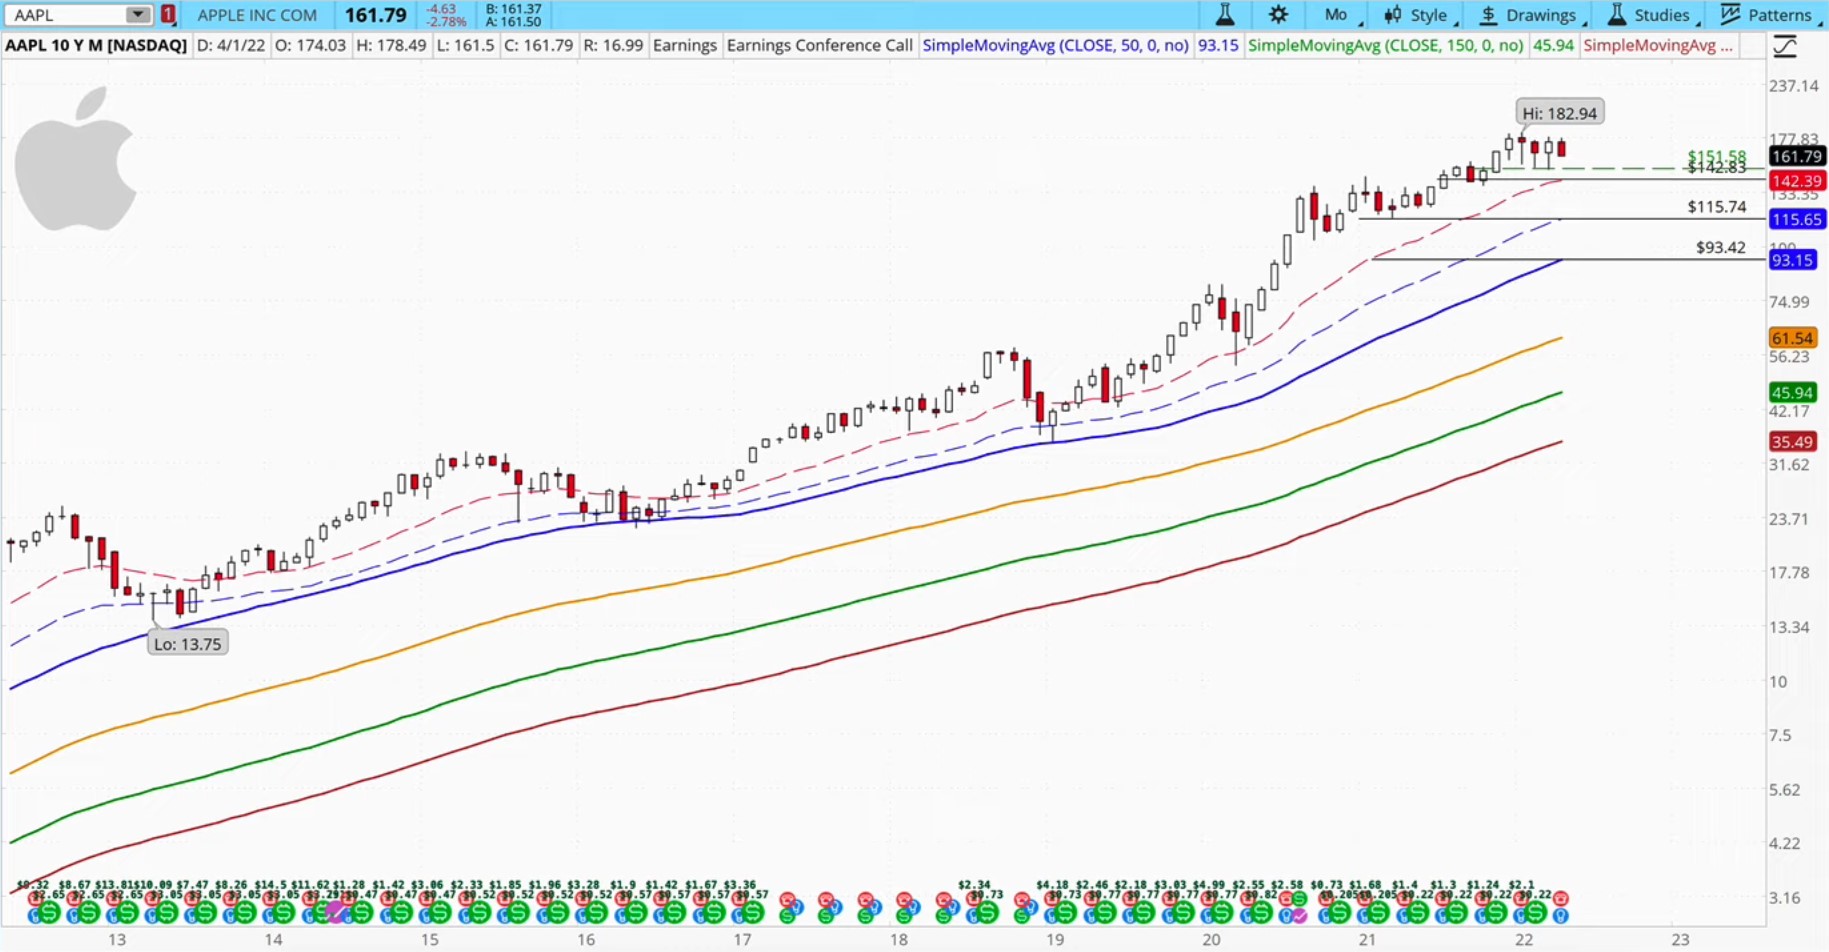
That strong support is definitely a buy level for Apple. It also finds support at the 40 ema at times so that's another buy level. You can see it also find support at the 20 ema, that's the red dotted line. So you can see that for Apple I've got 3 buy levels — $142, $115, and $93.
So for every stock, I have at least 3 to 4 buy levels. Why?
Because when Apple hits a buy level, I will start to buy some shares. I always average in my position with dollar-cost averaging, and so by doing that, I always ensure I never get in near the highs — always getting in near the lows as much as possible.
A Simple Technique That You Can Use
For those of you who are not sure how to use moving averages, I can share with you a very simple technique.
For example, if you are buying into the S&P 500, here's a simple rule of thumb:
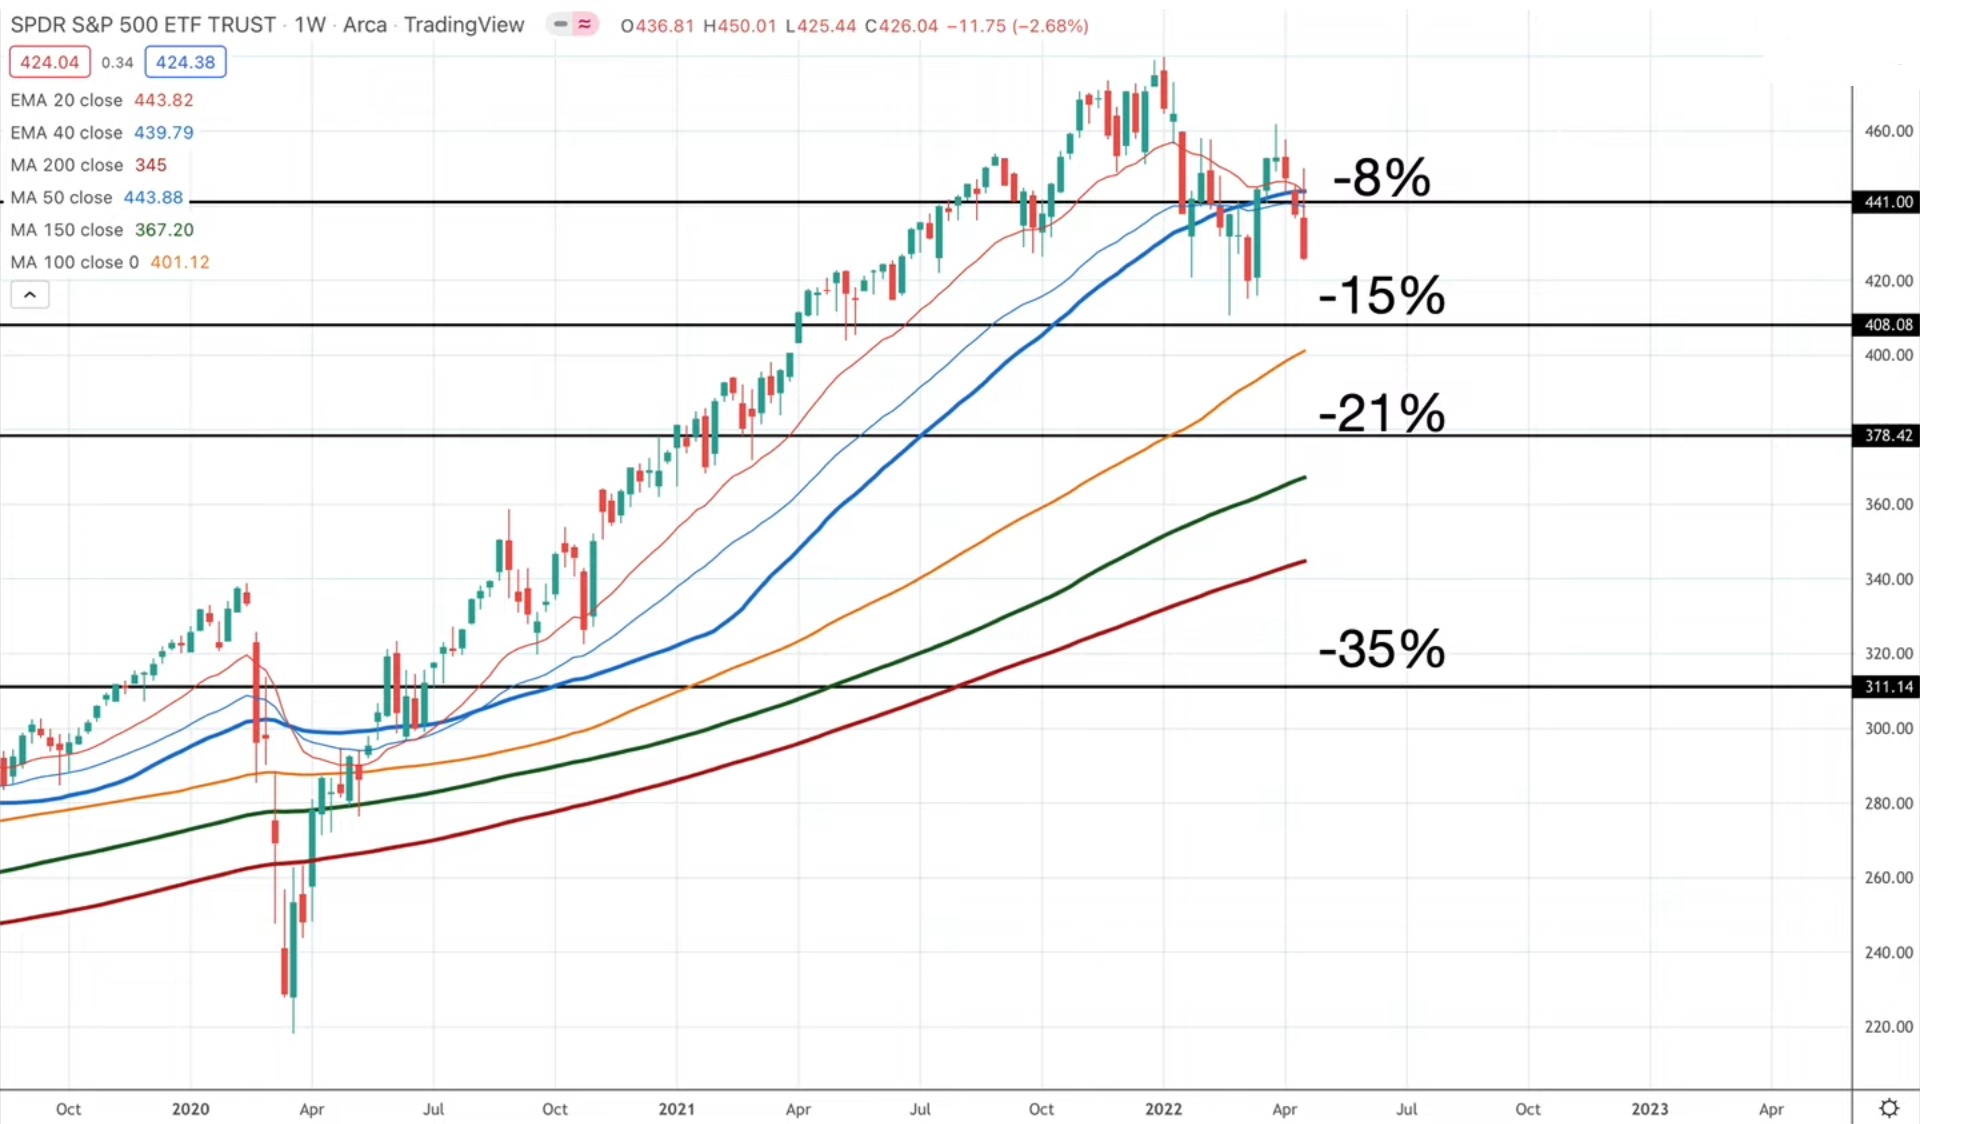
Buy your 1st tranche when the price drops 8% from the high. If it continues going down to 15% below the high, then you buy the 2nd tranche. If it drops 21% below the high, you buy the 3rd tranche, and if it drops to 35%, you buy your final tranche of stocks.
Why these numbers?
Why 15%? Because I've shown you that the average correction drop is 15%, and roughly what's half of 15% is about 7.5%, so I rounded off to 8% where you can begin your first buy level.
Why 21%? Because if you take the average of all the bear markets and all the corrections, the average drop is 21% across all declines. If you take the average drop across all bear markets, it's 35%.
You always want to have that last ammo to buy during a bear market, and if it doesn't hit that bear market, it's fine. You just go in 3 quarters of your planned allocation to a stock or investment. By doing so, you always ensure that you always have enough ammo to keep adding as the market keeps going down.
Profit From Short Term Fall In Price Using Options
So while I'm buying stocks as investments for the long run, at the same time when I see the market coming down in the short term, I'm shorting the market using put option spreads.
For example, last week when I saw that the S&P 500 was not able to break its resistance and began to close below the 50 moving average, I thought "Hey, chances are it's going to go down again in the short term to probably test this support level over there," so I have been shorting the markets, and I've been sharing this in my options trading group.
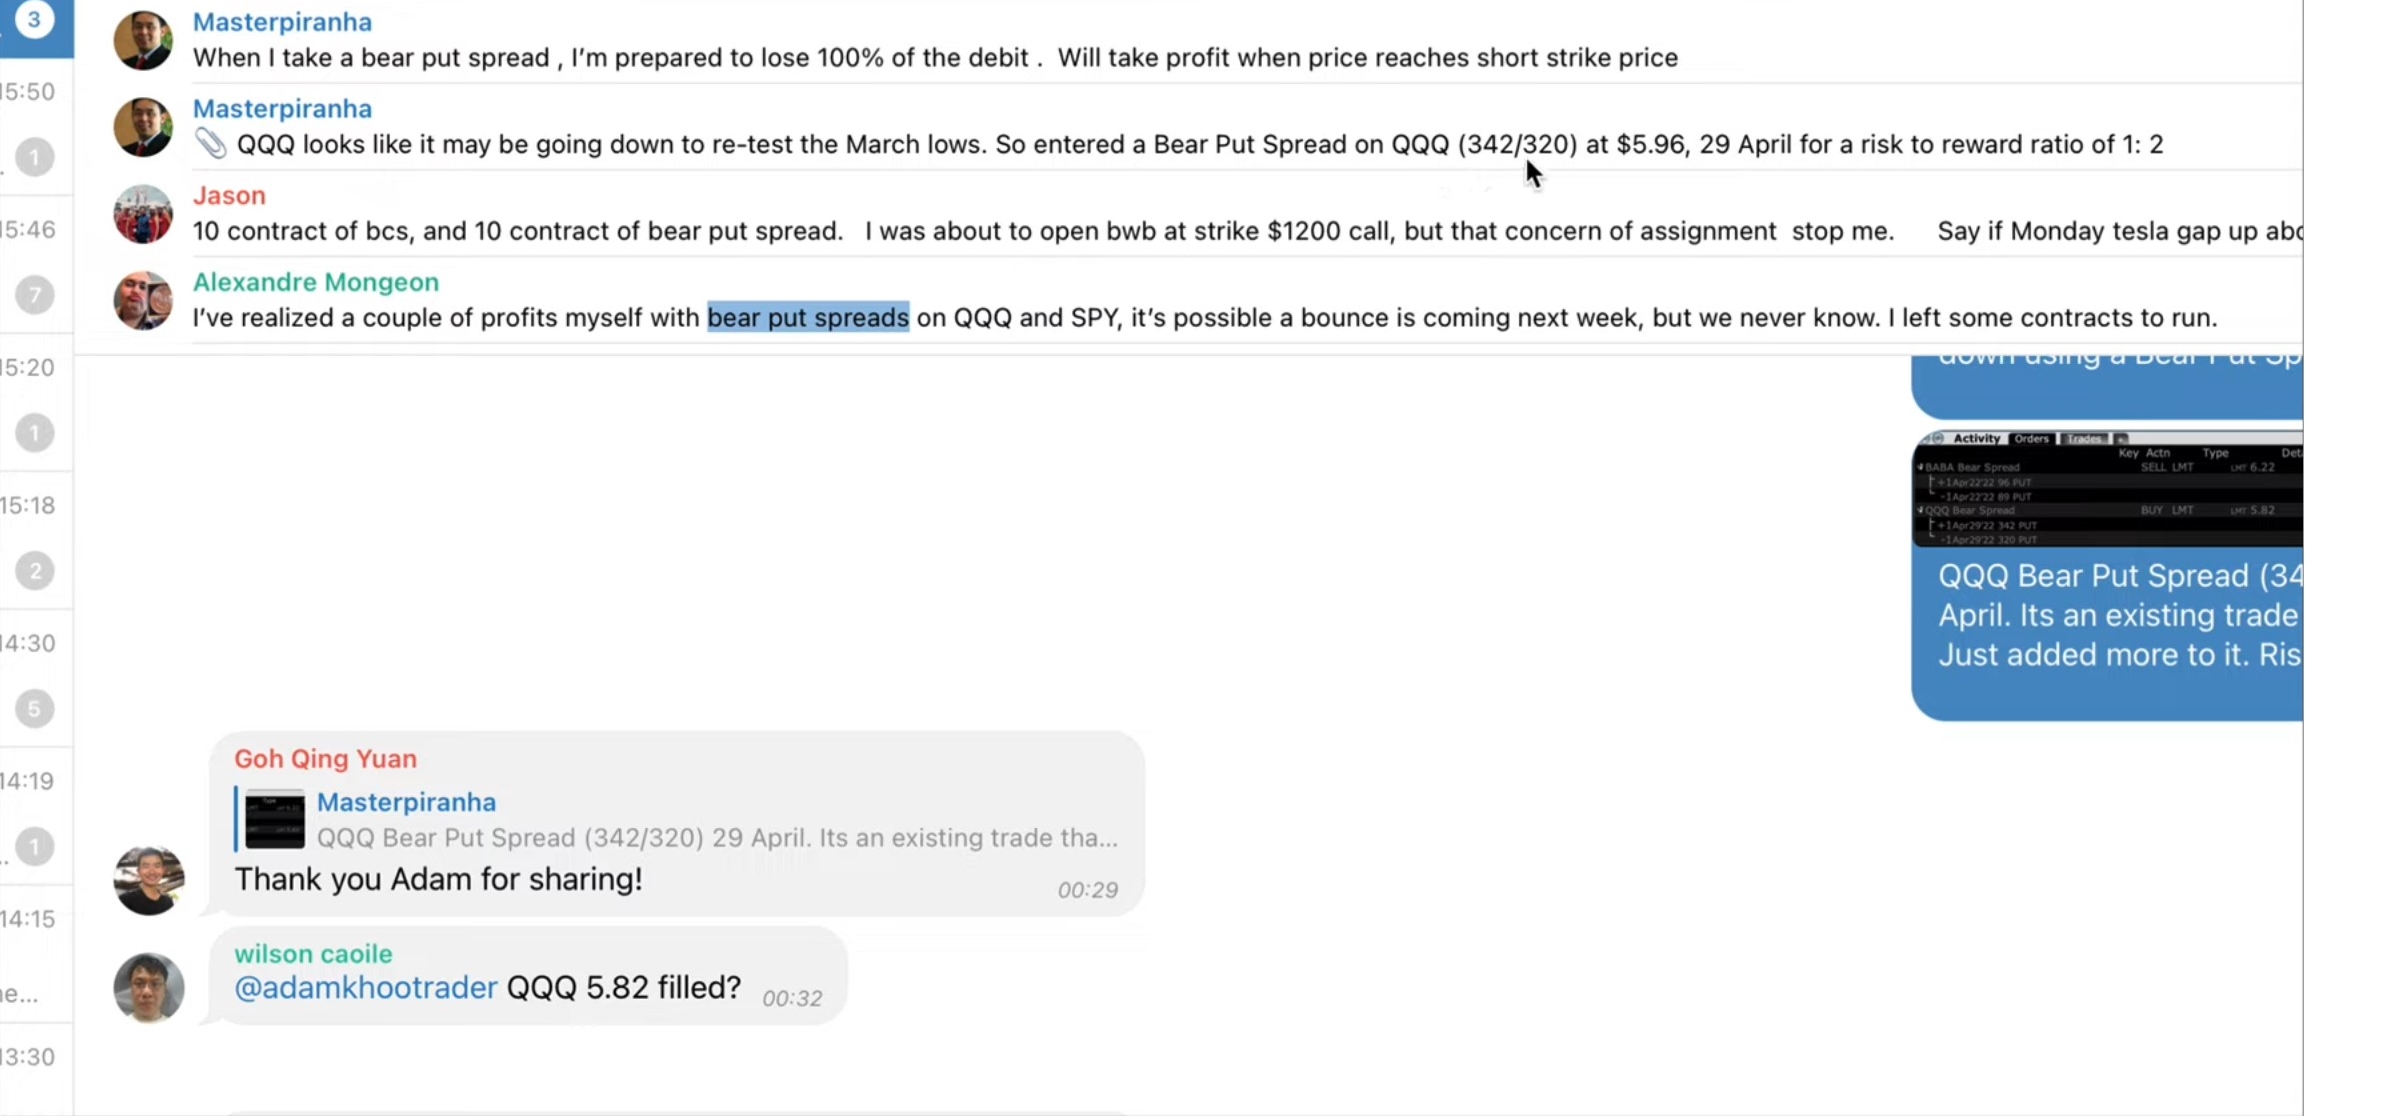
I've been shorting the QQQ as well, as early as the 11th of April. I entered a bear put spread on QQQ buying the 342 put and selling the 320 put for a risk-reward ratio of 1:2 and I explained the trade there.
I explained that "Hey you know what, it hit the 50 moving average, it's now coming back down so QQQ can't seem to break the resistance," so I entered more QQQ bear spreads.
I've also been shorting Alibaba. I've been shorting it in the short term, getting some profits, while still holding Alibaba in my long-term investment.
So that's always a way to have an investment and trade around that investment. So you also benefit during the short-term downtrends.
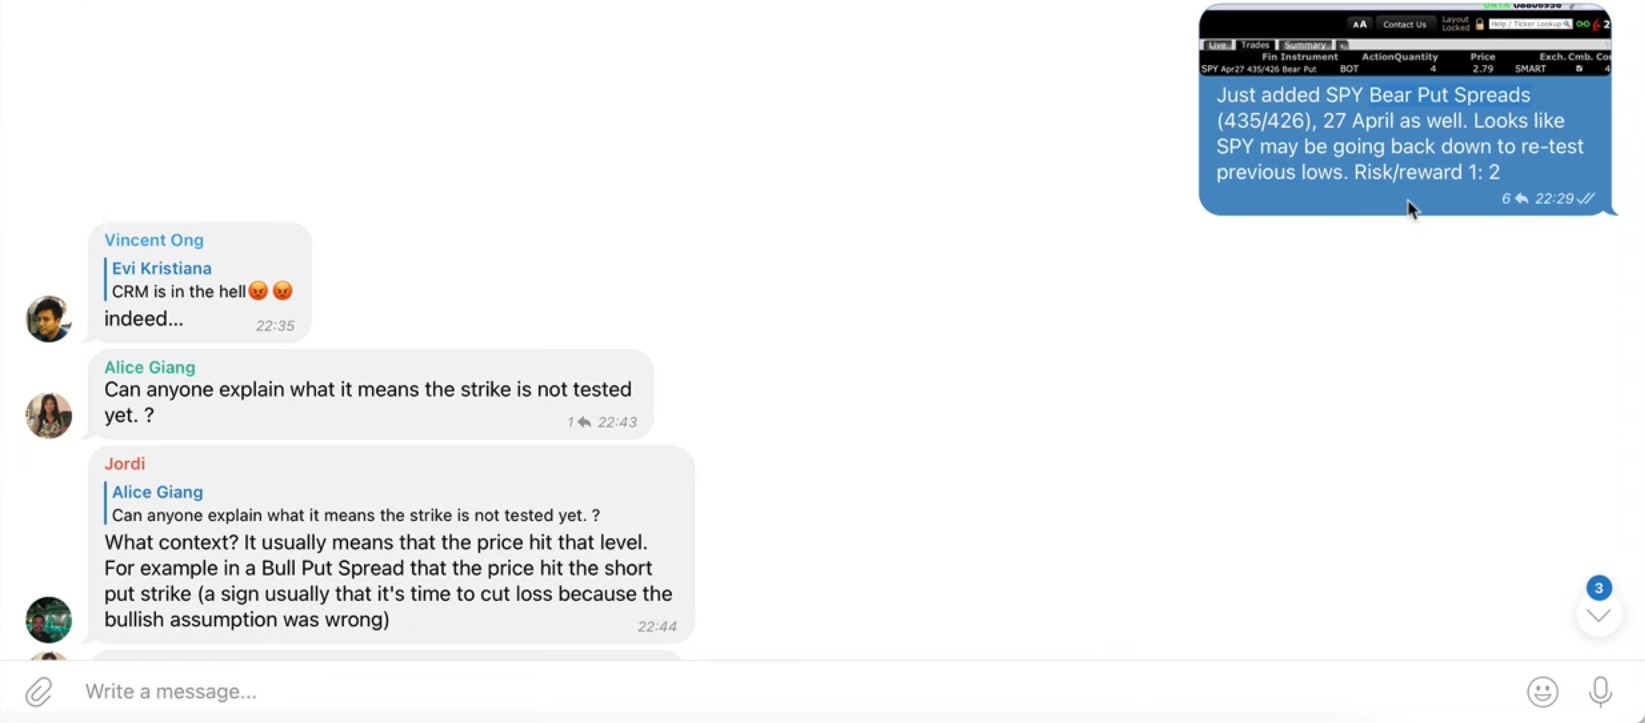
I also added some SPY bear put spreads as you can see last Friday as I expected the SPY to go down as well.
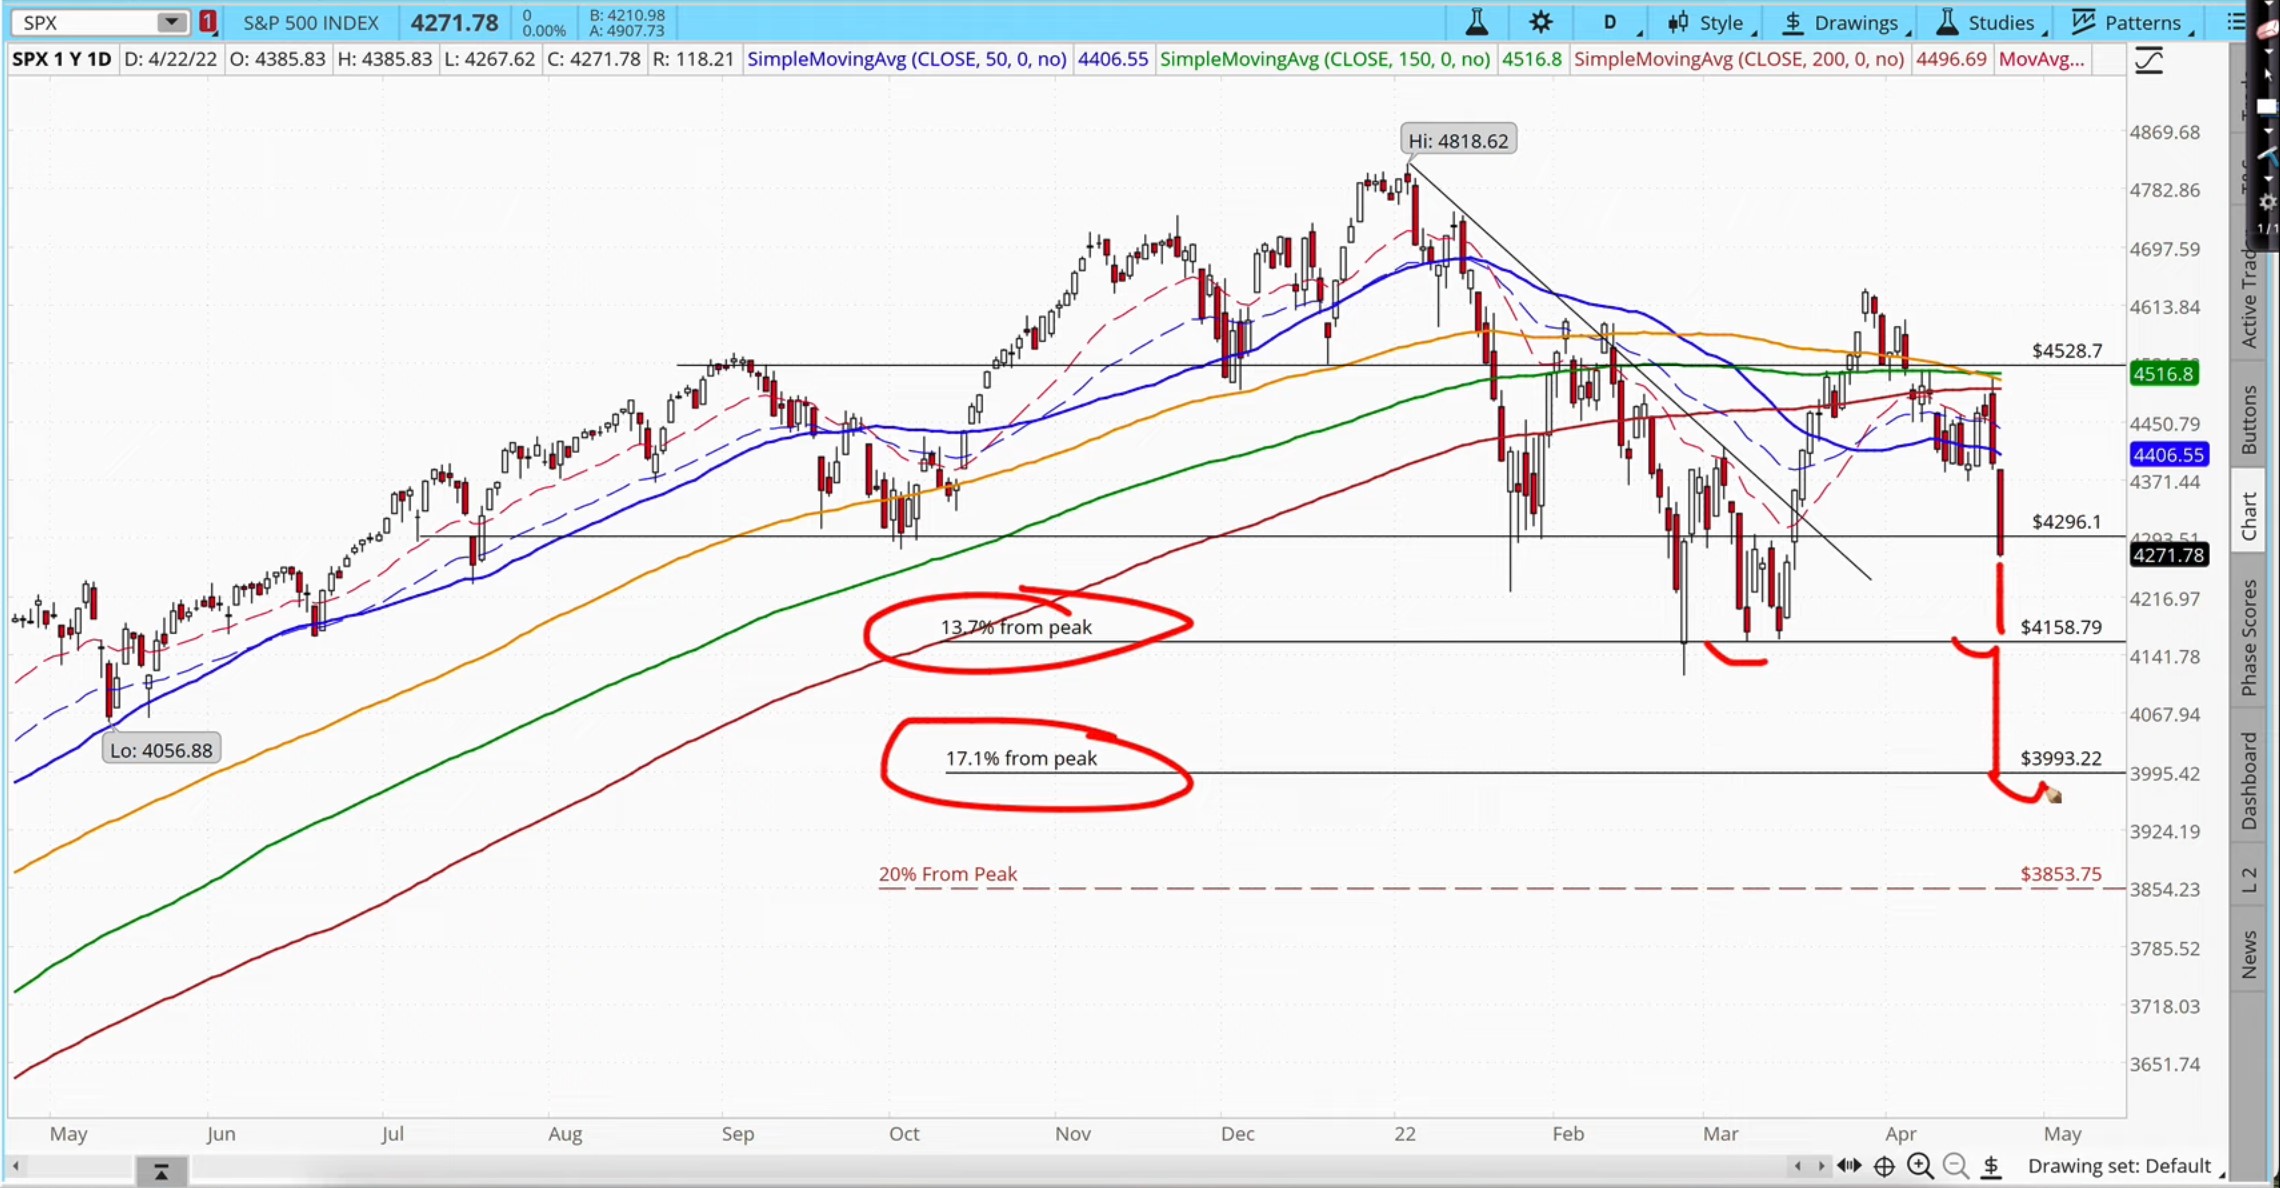
The bottom line in the short term, I do see the SPX going lower to re-test the lows there and it may even go down to 17.1%, which I highlighted earlier this year because the period during the U.S. midterm election has had a 17% decline on average.
But in the long run, the markets will go up in the long run good companies will always go up, so I'm buying good companies as well when they hit support levels.
The Bottom Line
Corrections don't last forever. Even bear markets don't last forever.
Corrections will end, and once it ends, the market will then take off again to new all-time highs. So never be afraid of corrections.
If you're holding great companies continue holding them, and I personally continue to add more and more shares to these great companies at lower prices, because once the market bottoms and the market makes new all-time highs, that's when you'll be richly rewarded.
Remember, the market transfers wealth from the impatient person to the patient
person, from the emotional person to the rational & logical person, and from the pessimist to the optimist.
You can choose to be patient, to be optimistic, and to be rational, and you will build your wealth over time. I guarantee that.
May the markets be with you always, and hang in there for the ride, because it will only get a lot better!
If you want to learn how to trade the markets with a complete investing skillset, check out our WHALE INVESTOR™ Course, where I'll be teaching you how to invest in great companies using my Value Momentum Investing™ strategy.


submit your comment