The stock market looks like it's collapsing with no bottom in sight and we have yet another down week in the markets. But something interesting happened.
— Table Of Contents —
Bear Trap Pattern On The S&P 500
The Media Is Extremely Bearish, Which Is Why I'm Really Bullish
The Market Is Reaching A Tipping Point
10-Year Yield & Inflation Might Have Peaked
Bear Trap Pattern On The S&P 500
If you look at the S&P 500, it went within the Bear Market territory again.
Remember — a bear market is officially when the market closes 20% below the peak.
Just as it went 20% below the peak, some of the news media were already calling, "A bear market has started! A bear market started!", but interestingly before the market closed on Friday (20th May), it closed back above that 20% level. It's narrowly avoiding that official bear market term in the S&P 500.
So it's kind of like the market's teasing us, right. It's like: bear market; no bear market; bear market; no
bear market — We'll see what's going to happen.
But the market formed a pattern that is known as a classic 'Bear Trap'.
A bear trap is when the market looks like it's going into a bear market, and when it goes below that 20% mark, a lot of traders went short, and at the last moment, the market kind of like trapped them and closed back above that 20% mark.
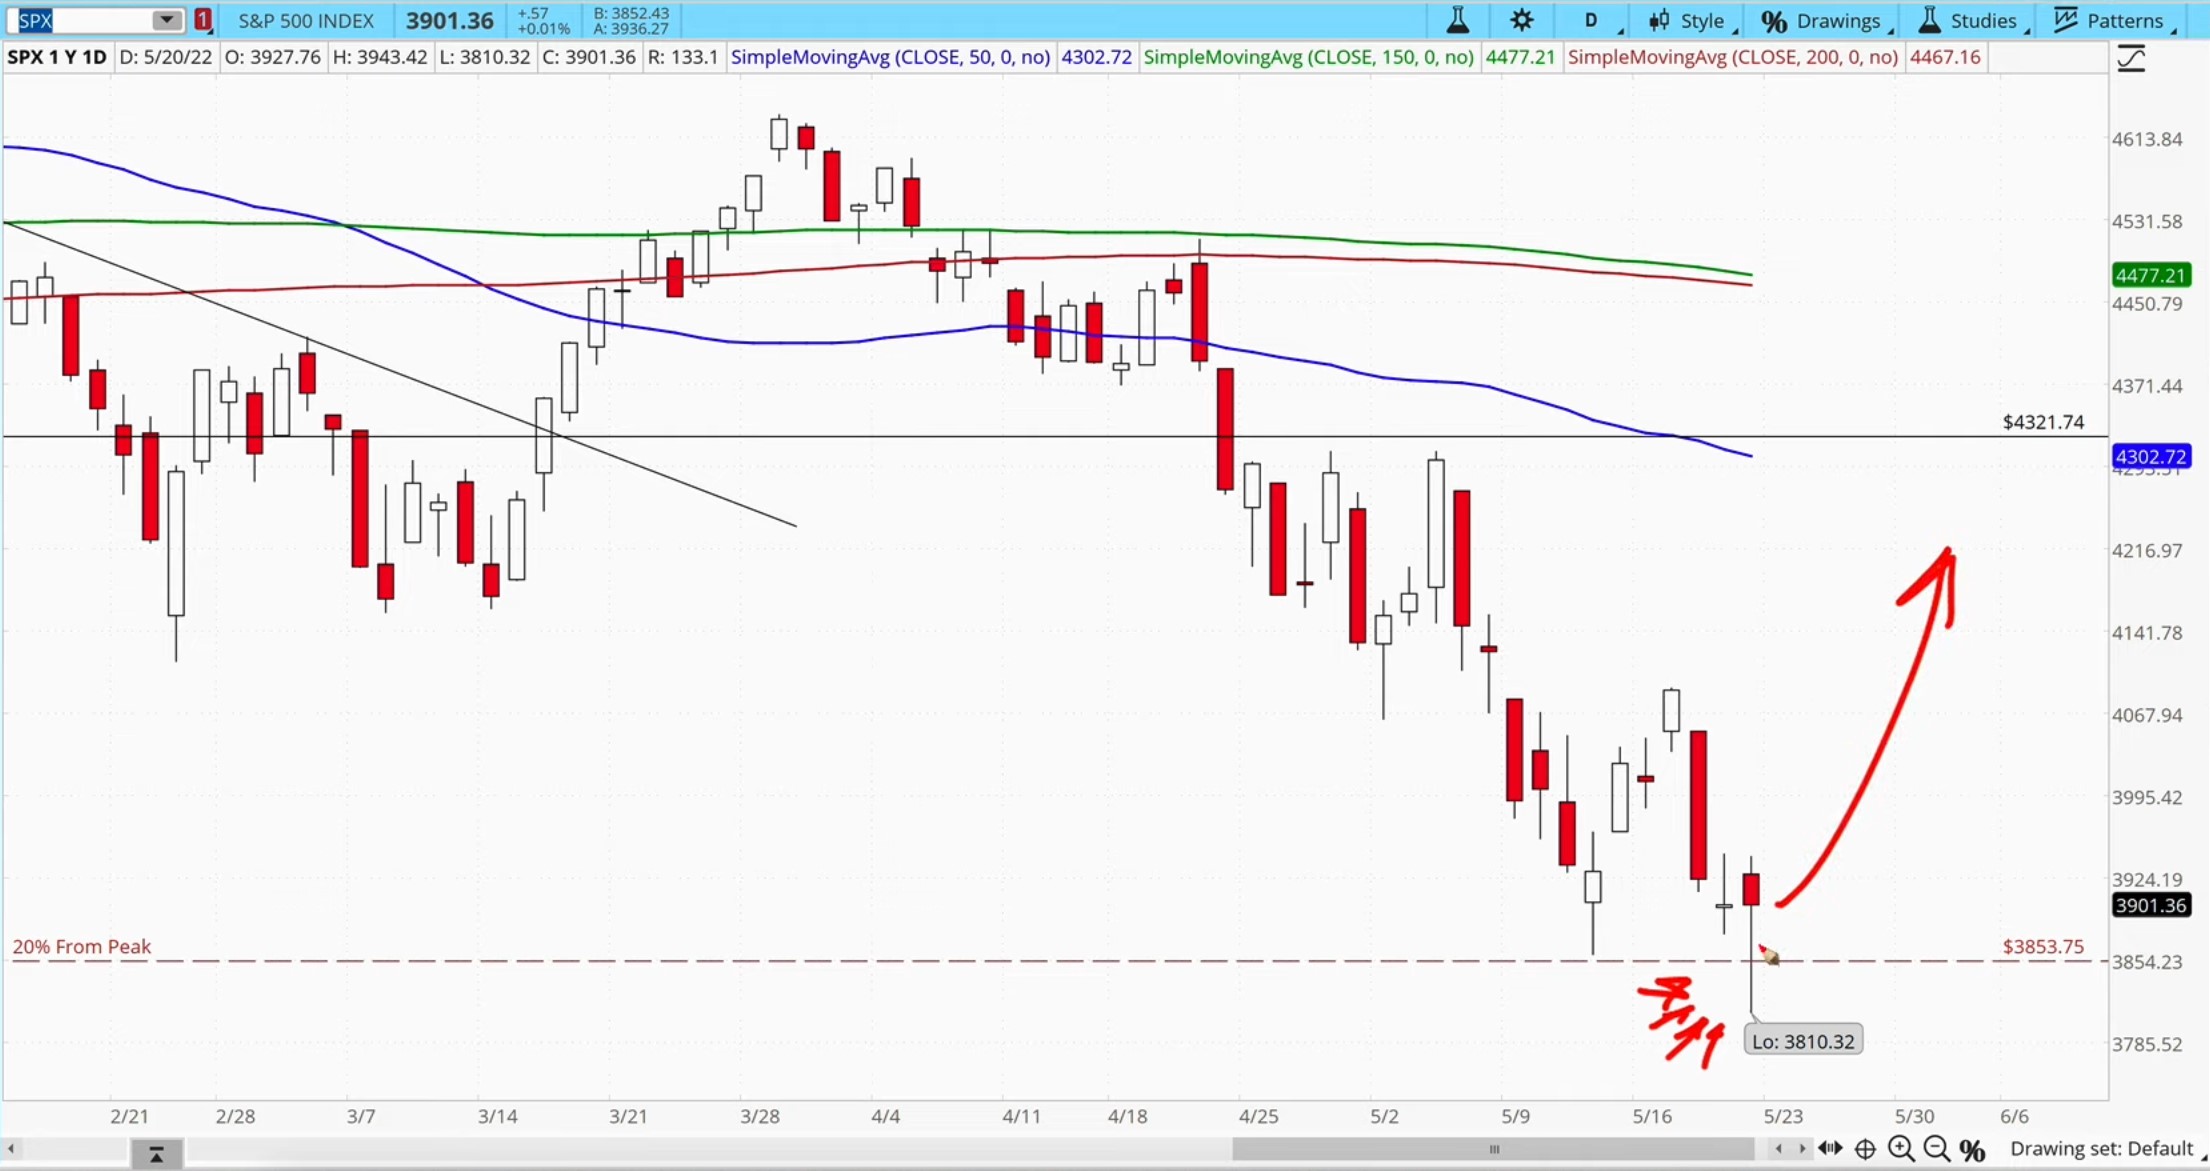
So if the market rallies next week, these bears that went short are gonna get killed. That's why we call that a bear trap. So what are the chances of that happening?
We're gonna take a look in a short while.
So that's the S&P 500. Now if you look at the NASDAQ, we had that same pattern except for the NASDAQ, it's already been in a bear market for quite a while. In fact, it's now down close to 30% below the peak and again, we had that bear trap pattern.
The Media Is Extremely Bearish, Which Is Why I'm Really Bullish
Now if you take a look at the media, there were 2 interesting points that were made.
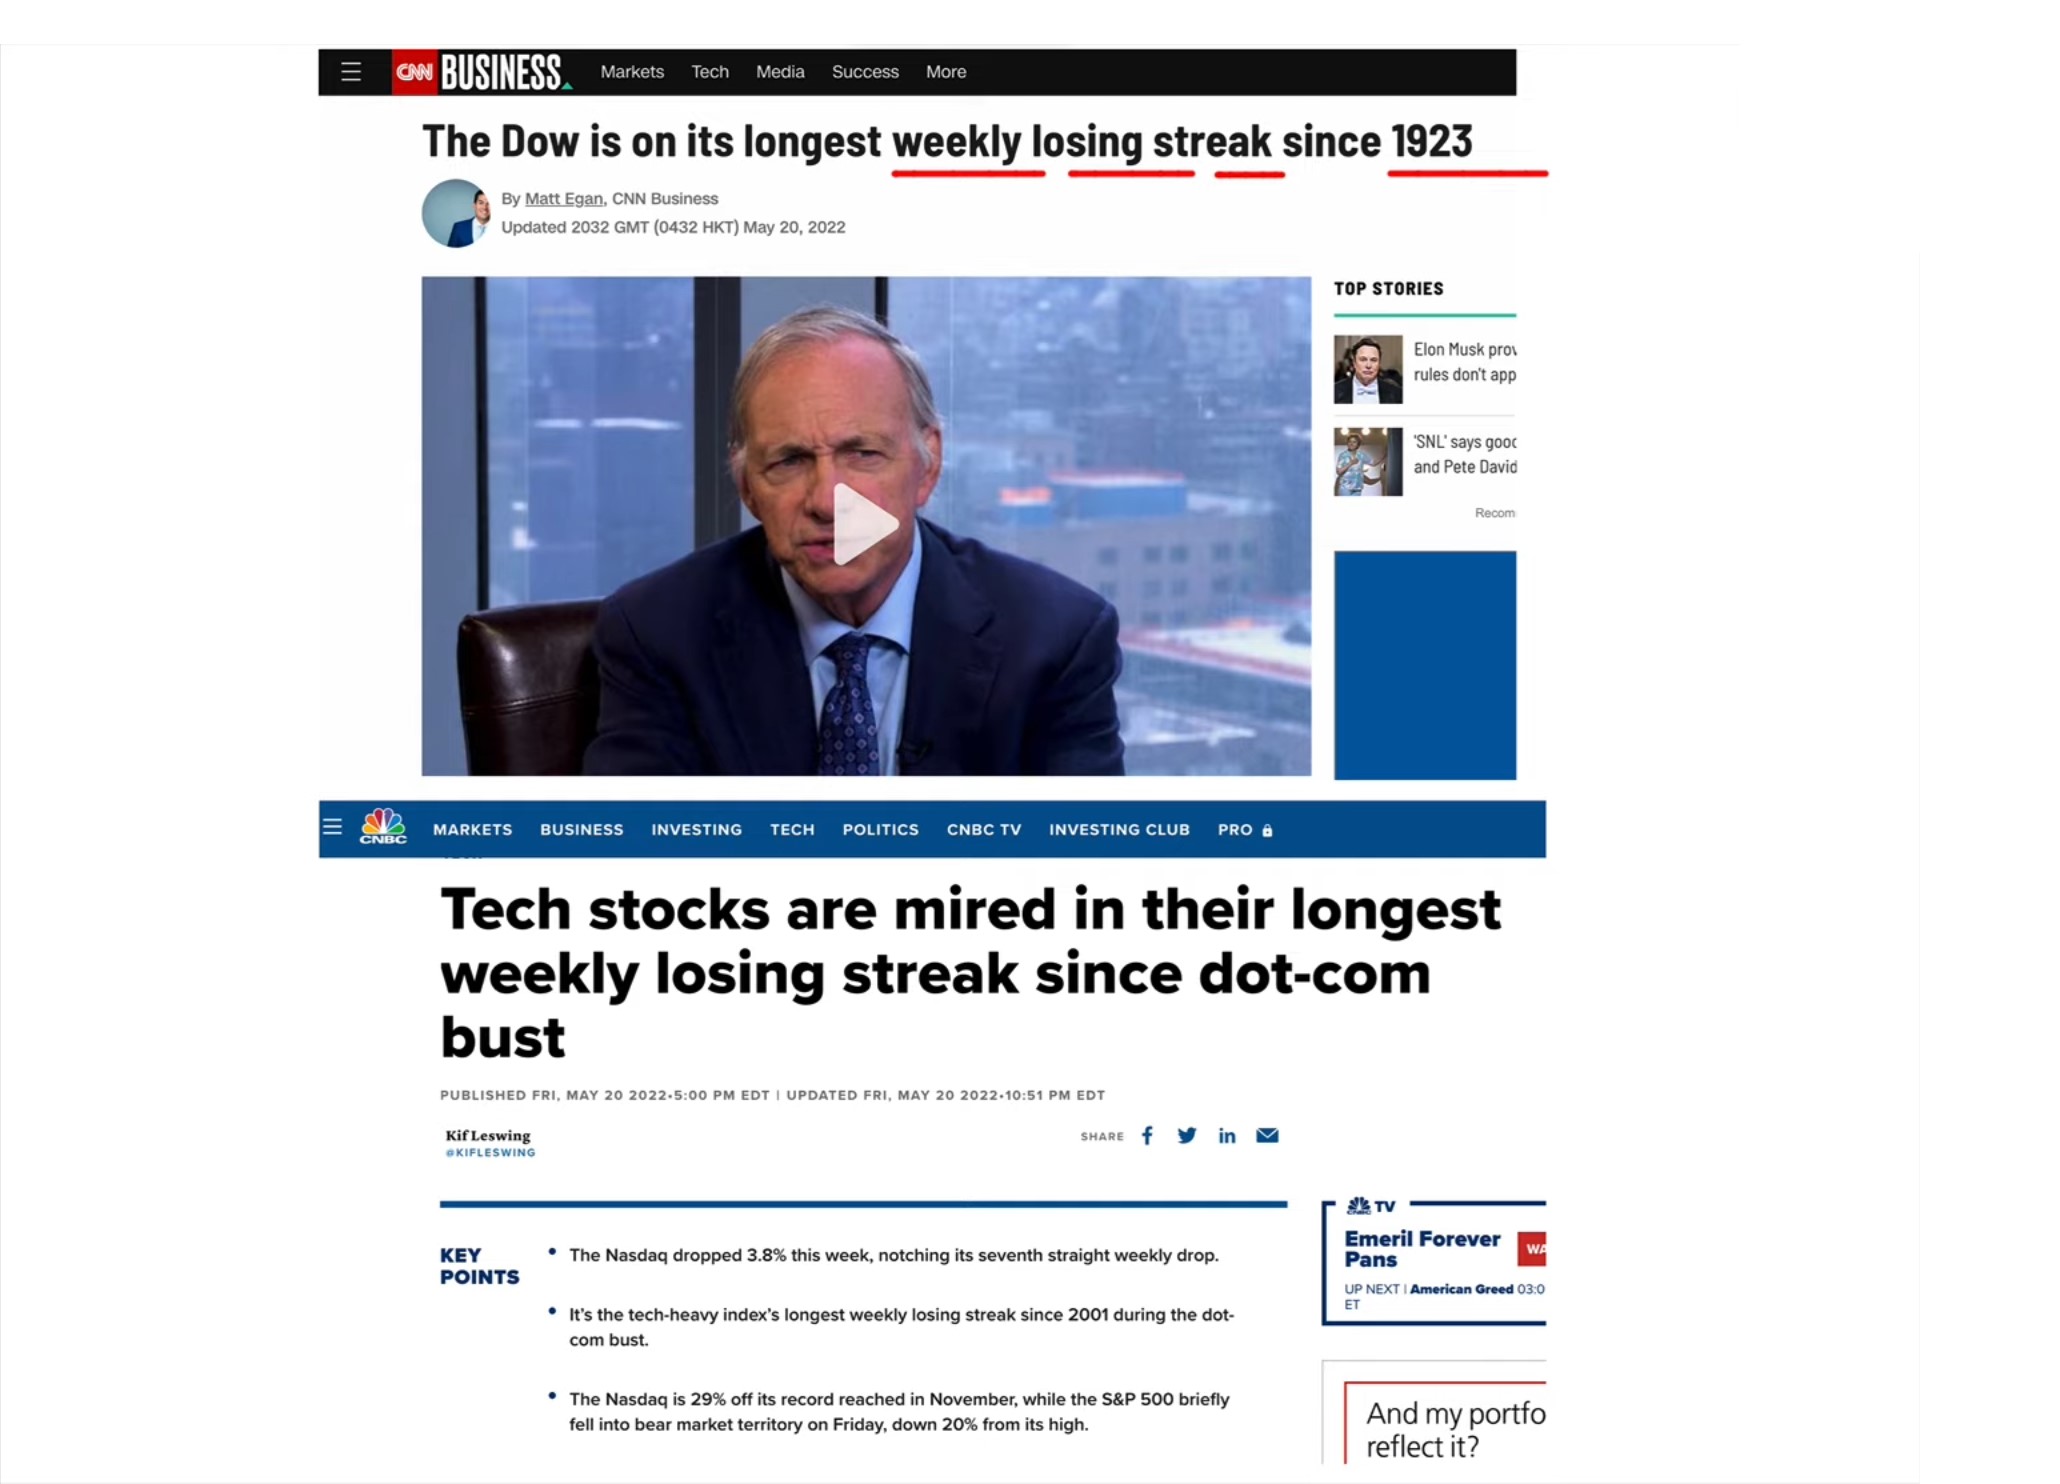
The DOW Jones is on its longest weekly losing streak since 1923. That's almost A HUNDRED YEARS.
So if you look at the DOW Jones, it has gone down for 8 weeks in a row — 8 weekly bearish candles, and that's the longest losing streak since 1923. So it's a pretty historic moment.
How about the NASDAQ?
The NASDAQ and the S&P have had 7 red weekly candles in a row — 7 weekly declines in a row, and it's the longest losing streak since the DOT-COM crash back in 2000.
So the market is so extremely bearish that I'm actually getting really bullish, and I expect a very strong rally in the markets within the next couple of days.
Now before you're thinking "Adam what are you smoking? Are you high?"
No, I'm not.
You have to understand that the market is kind of like a pendulum — it swings from one extreme to another extreme. It's such that when the market gets really bearish that's when it turns bullish. Once it gets really bullish, that's when it turns bearish.
The Market Is Reaching A Tipping Point
So what evidence is there to support that the market is reaching a tipping point where it's going to flip over?
Well, a couple of things that I'm looking at.
The FIRST thing I'm looking at is the 'Fear & Greed Index' and right now we are at the EXTREME FEAR level. Historically every time the Fear & Greed Index goes into extreme fear, it has always marked turning points in the market, where the market tends to flip back upwards.
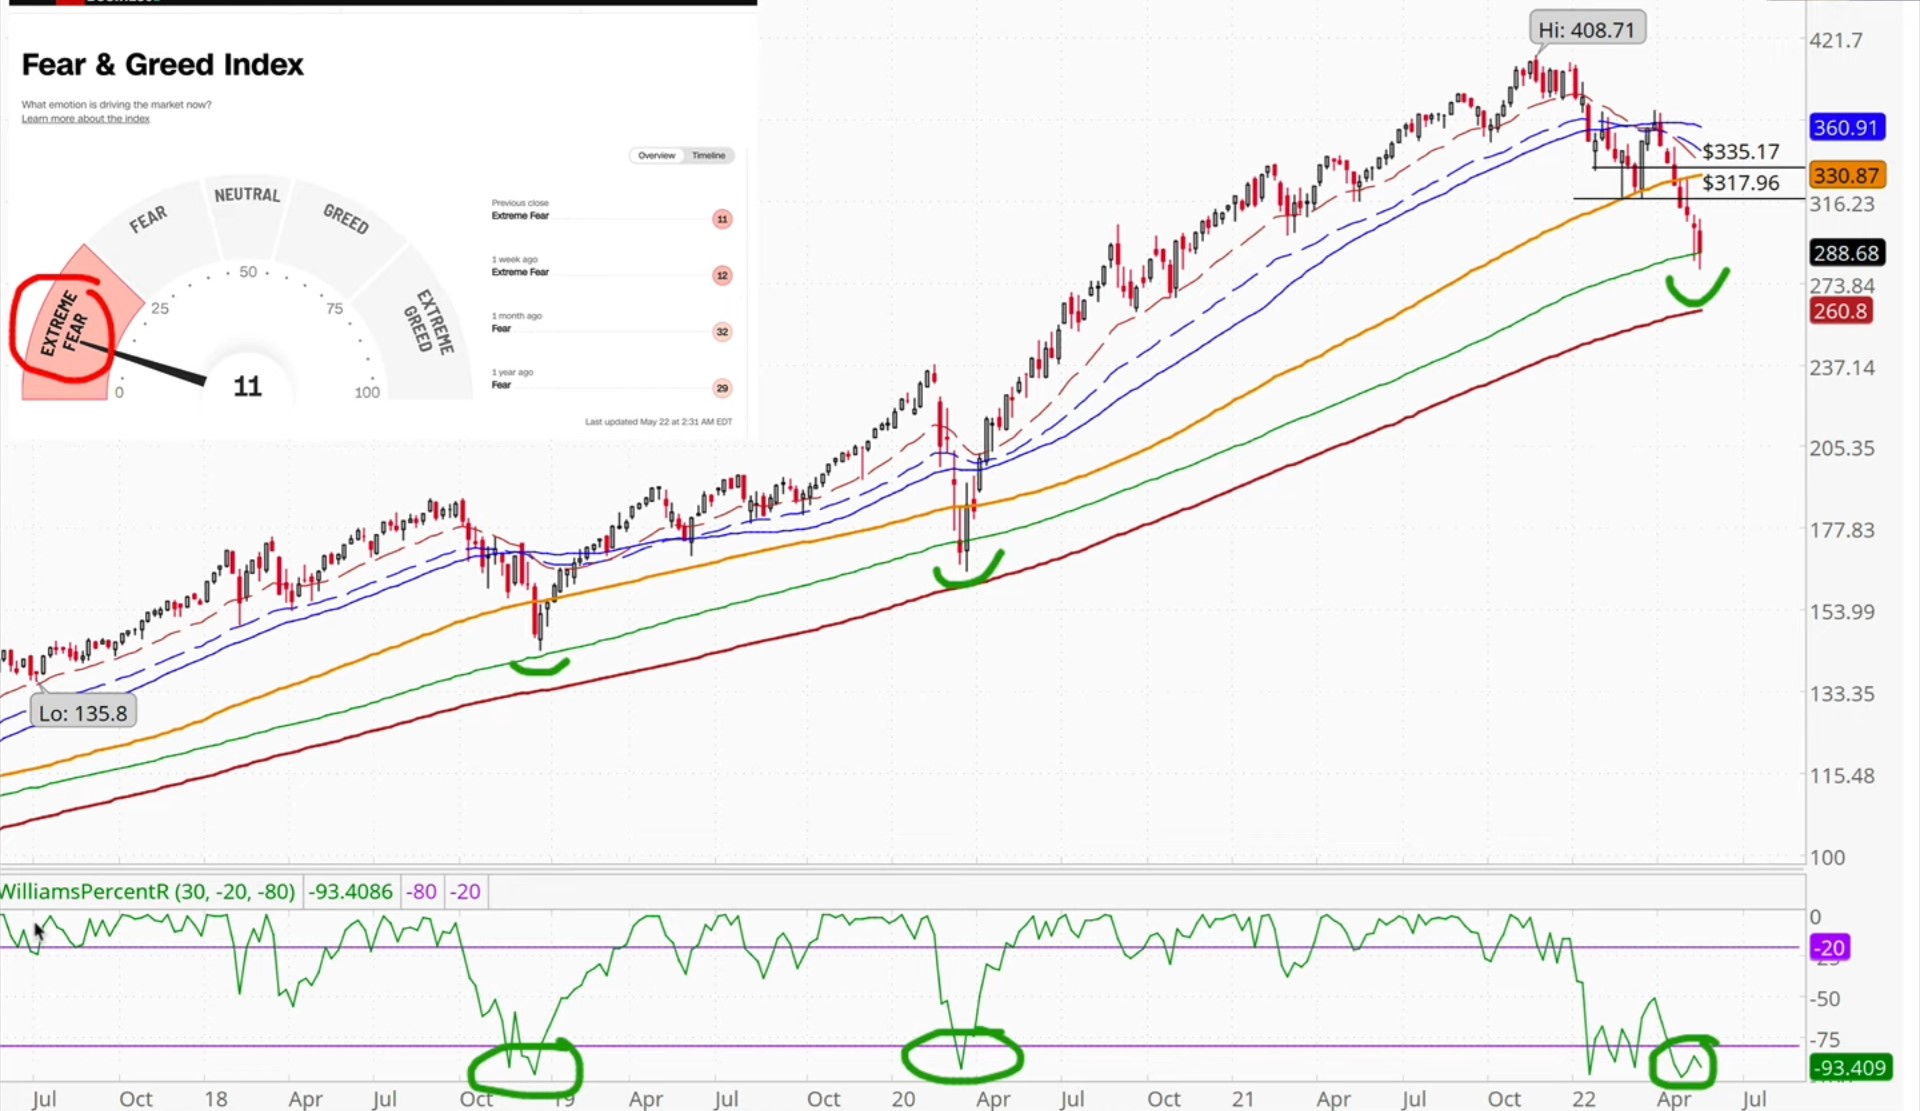
The SECOND thing is, if you look at the Williams %R or you can look at the Stochastics or RSI on the weekly basis, it's again at EXTREMELY OVERSOLD levels as you can see. This has always coincided with market reversal bottoms. Right now we are here, so again this is another sign that we are deeply oversold — markets extremely bearish and there are signs that the market is gonna flip really really soon.
Now in trading, you don't just look at one indicator or one pattern that gets you to form a thesis to go long to or to go short. You look at multiple indicators of signals and you're building a confluence case where many signals tell you the same thing — the probabilities would be a lot higher.
We are oversold in the markets. We are at extreme fear levels, and something interesting has happened as well. If you take a look at the S&P 500 as well as the NASDAQ, you will see DIVERGENCE between the price going down and the advance and decline line.
The advance and decline line measure the number of stocks advancing versus the stocks declining, and for the first time, the advance and decline line is going up when the market has gone down. So that's a very interesting development.
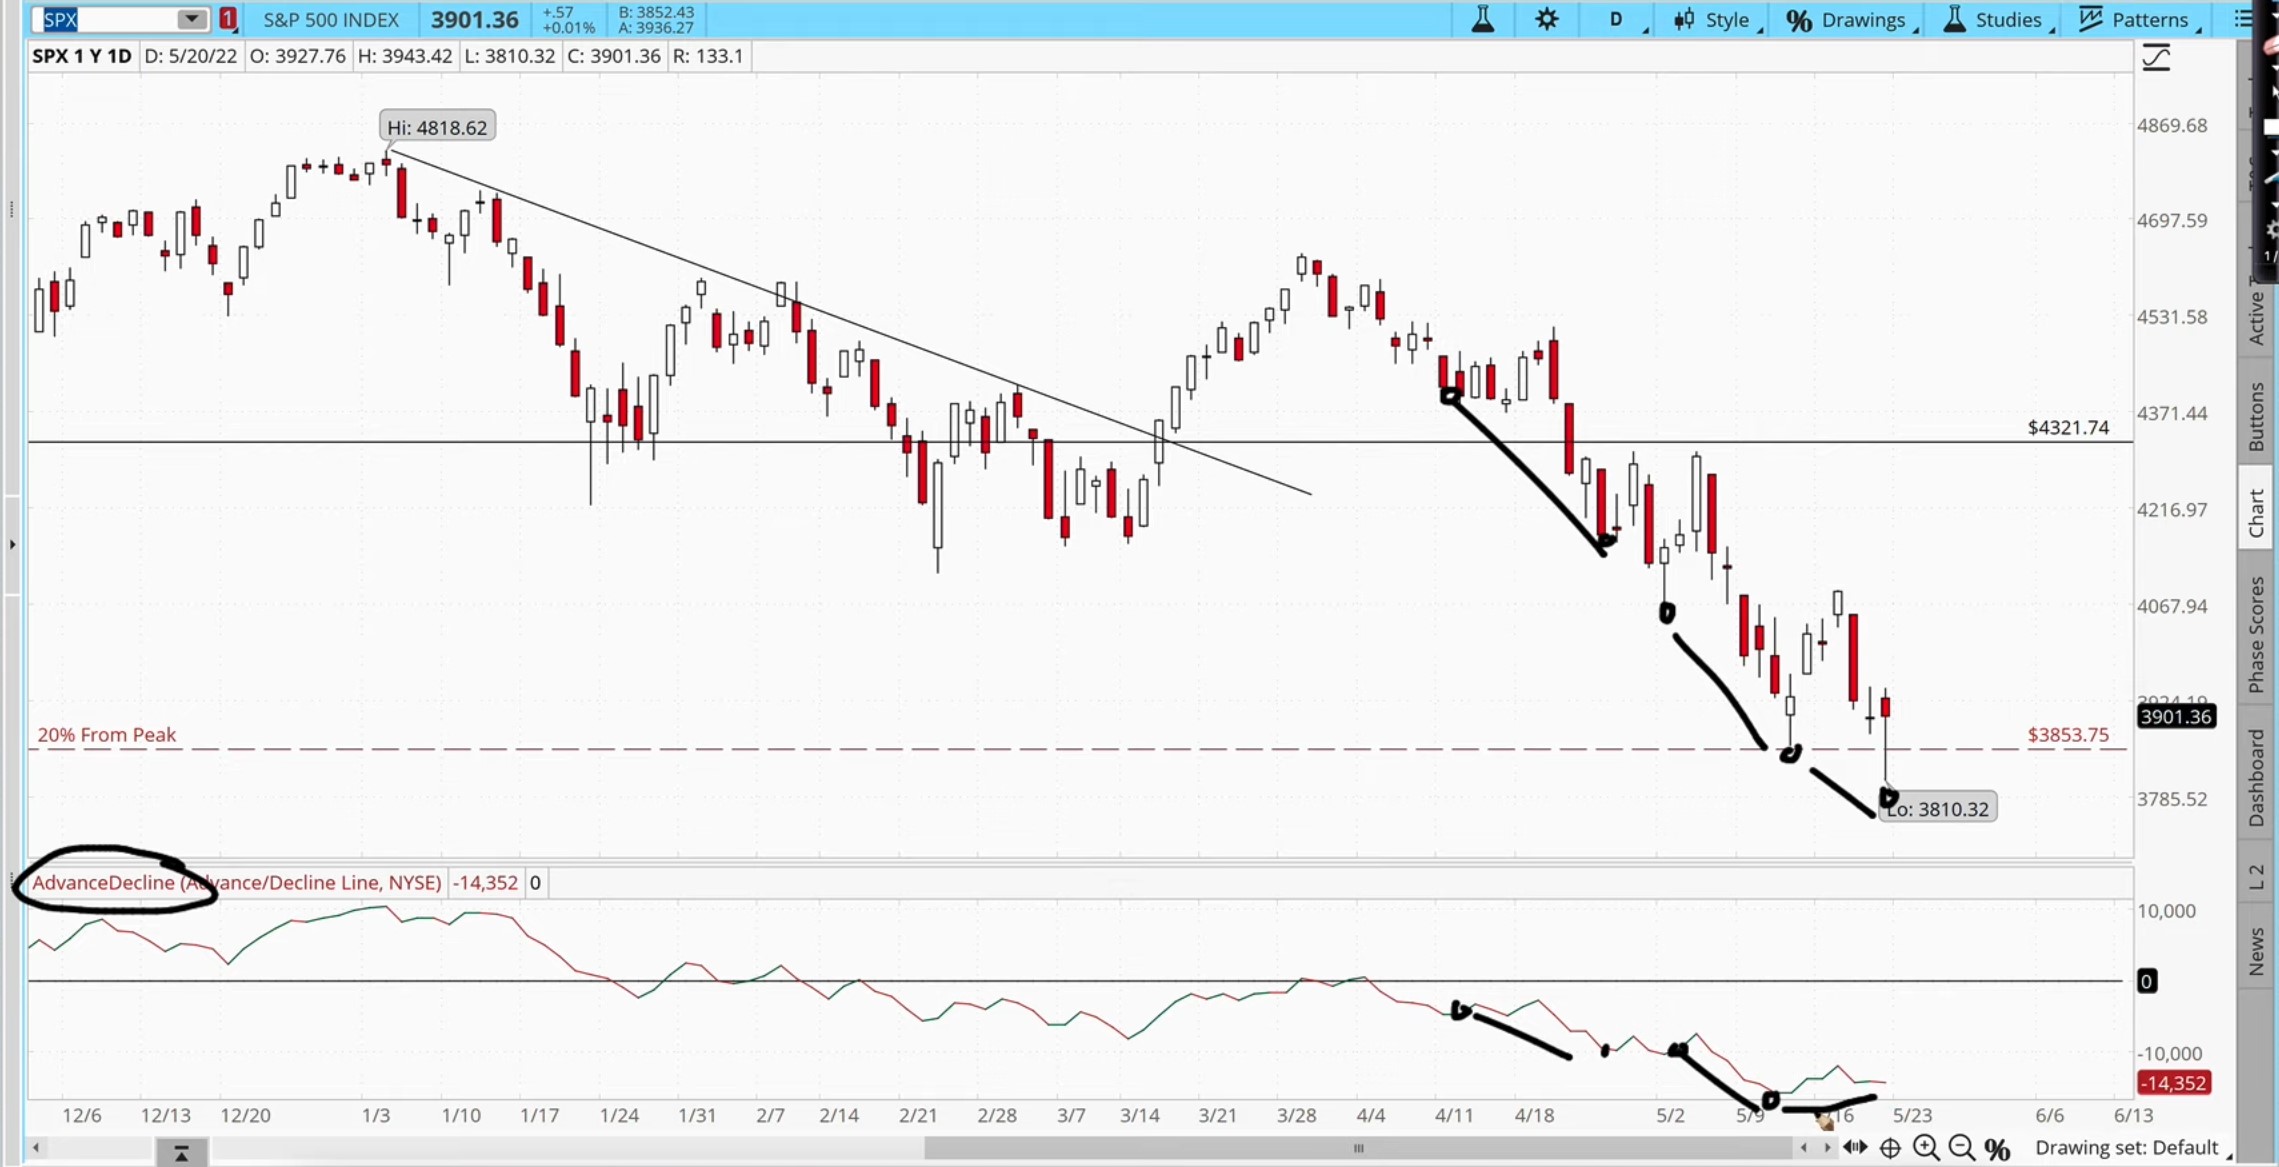
Notice that every time the market went down there are more decliners than advancers, whereas in this recent week although the market went lower, the advanced decline line for the first time during this correction is actually going higher.
So in other words, below the hood you can see that there are stocks that are actually gaining — there are more gainers than decliners, and we call this a level of divergence in the market, which again could be another point of confluence that a market is going to start reversing soon.

subscribe to our newsletter today!
Get first dibs on our latest investing & trading content every week FOR FREE!
*Your email address will not be forwarded to any third party. We respect your privacy.
10-Year Yield & Inflation Might Have Peaked
Now the 10-year yield in a way has been the market's expectations of inflation. So because of higher inflation, the 10-year yield has been rising.
The moment the 10-year yield starts to come down, it's telling you that the market is beginning to see inflation come back down. Once inflation comes back down and the FED doesn't have to raise rates as aggressively, the market will have a huge change in sentiment.
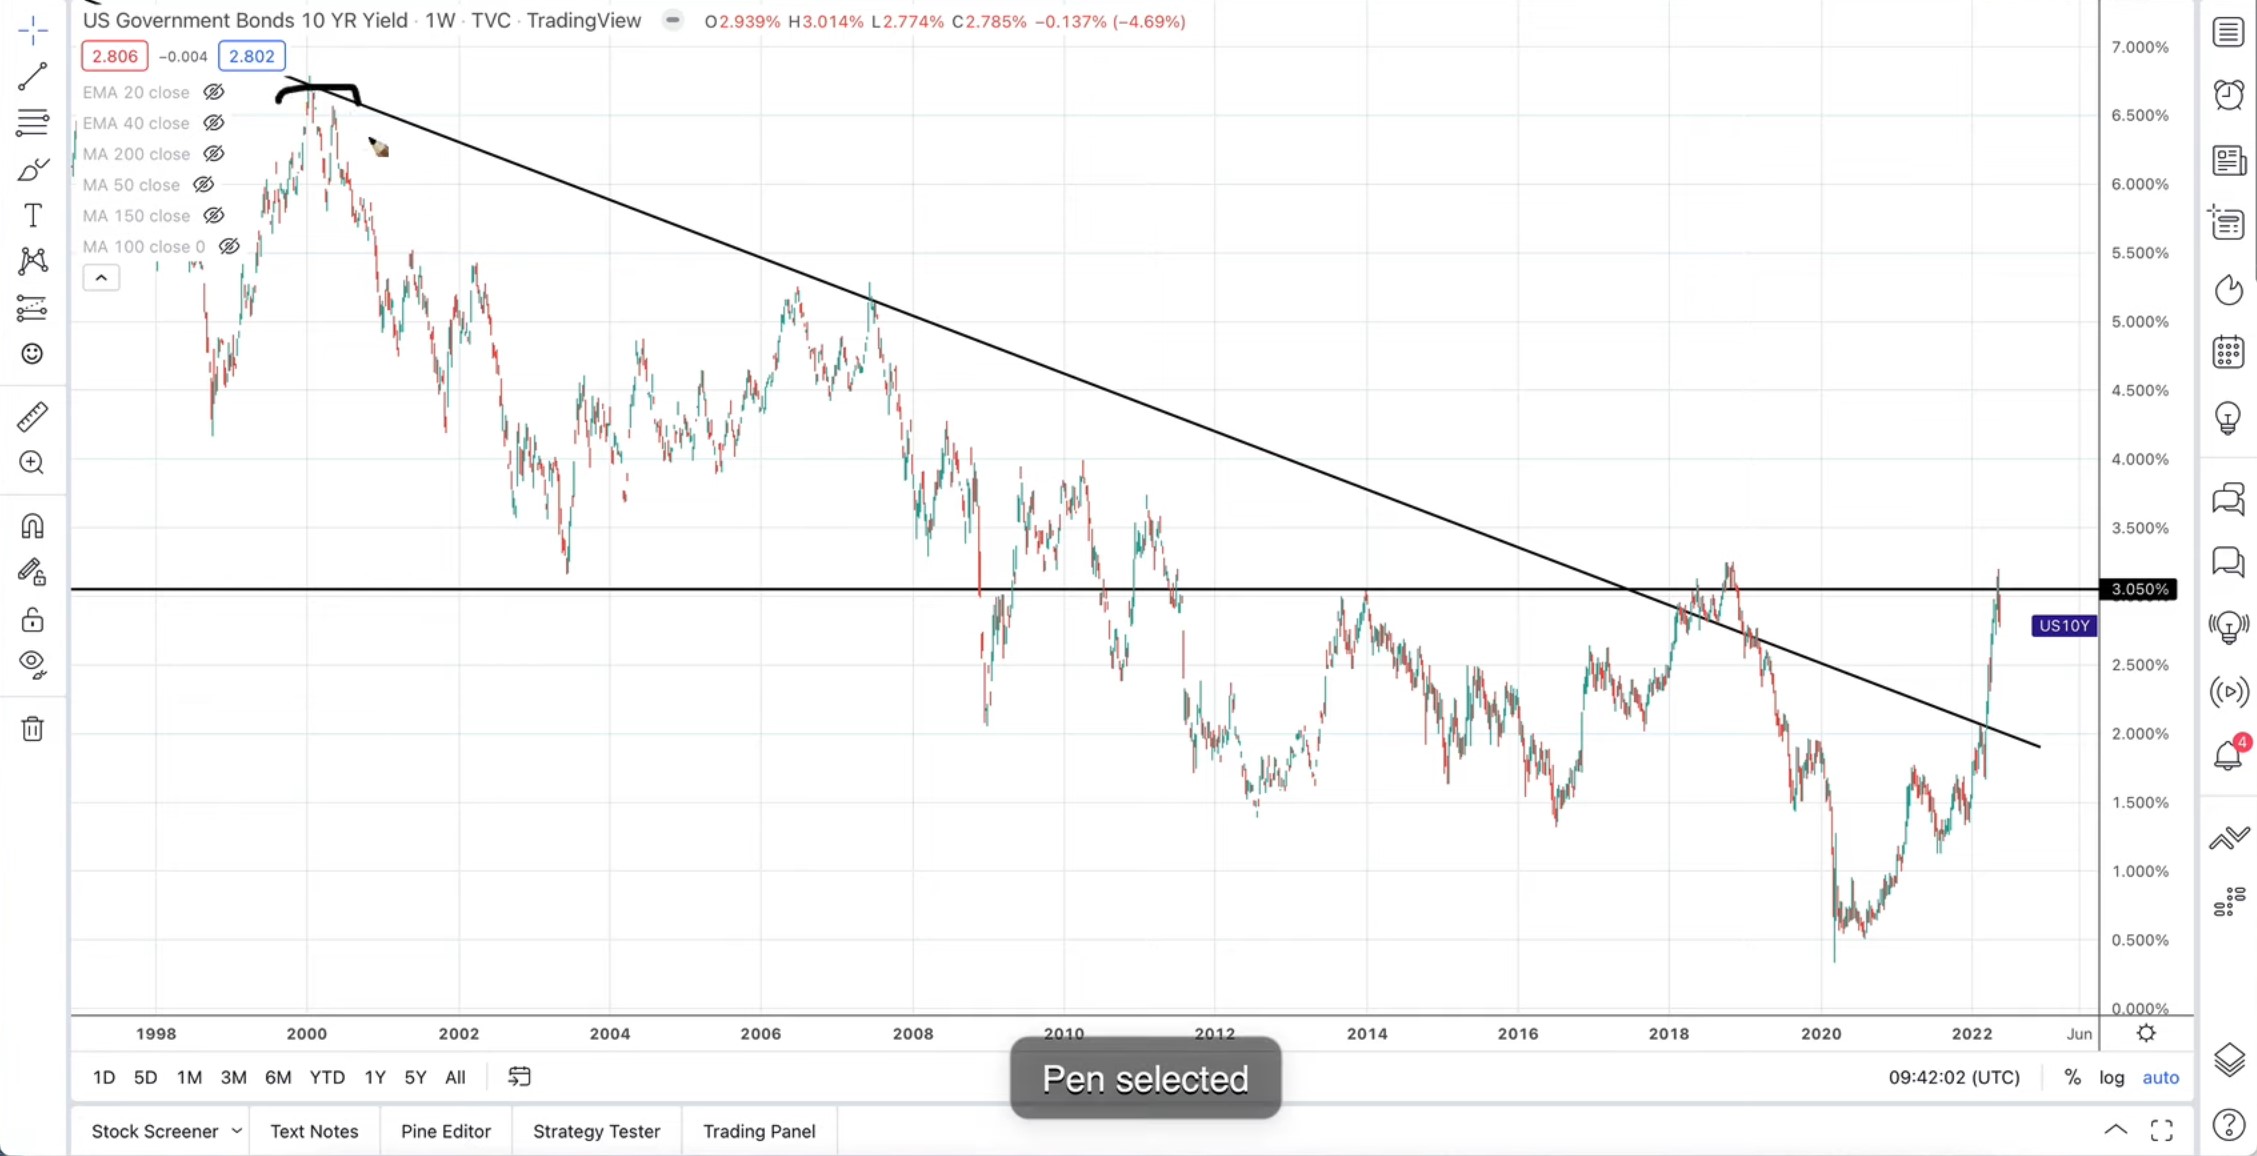
Now if you take a look at a 10-year yield, you'd notice that it's beginning to look like it's topping off. Long term, you can see the resistance on the 10-year yield, and it broke above that trending resistance but there's a very strong horizontal resistance.
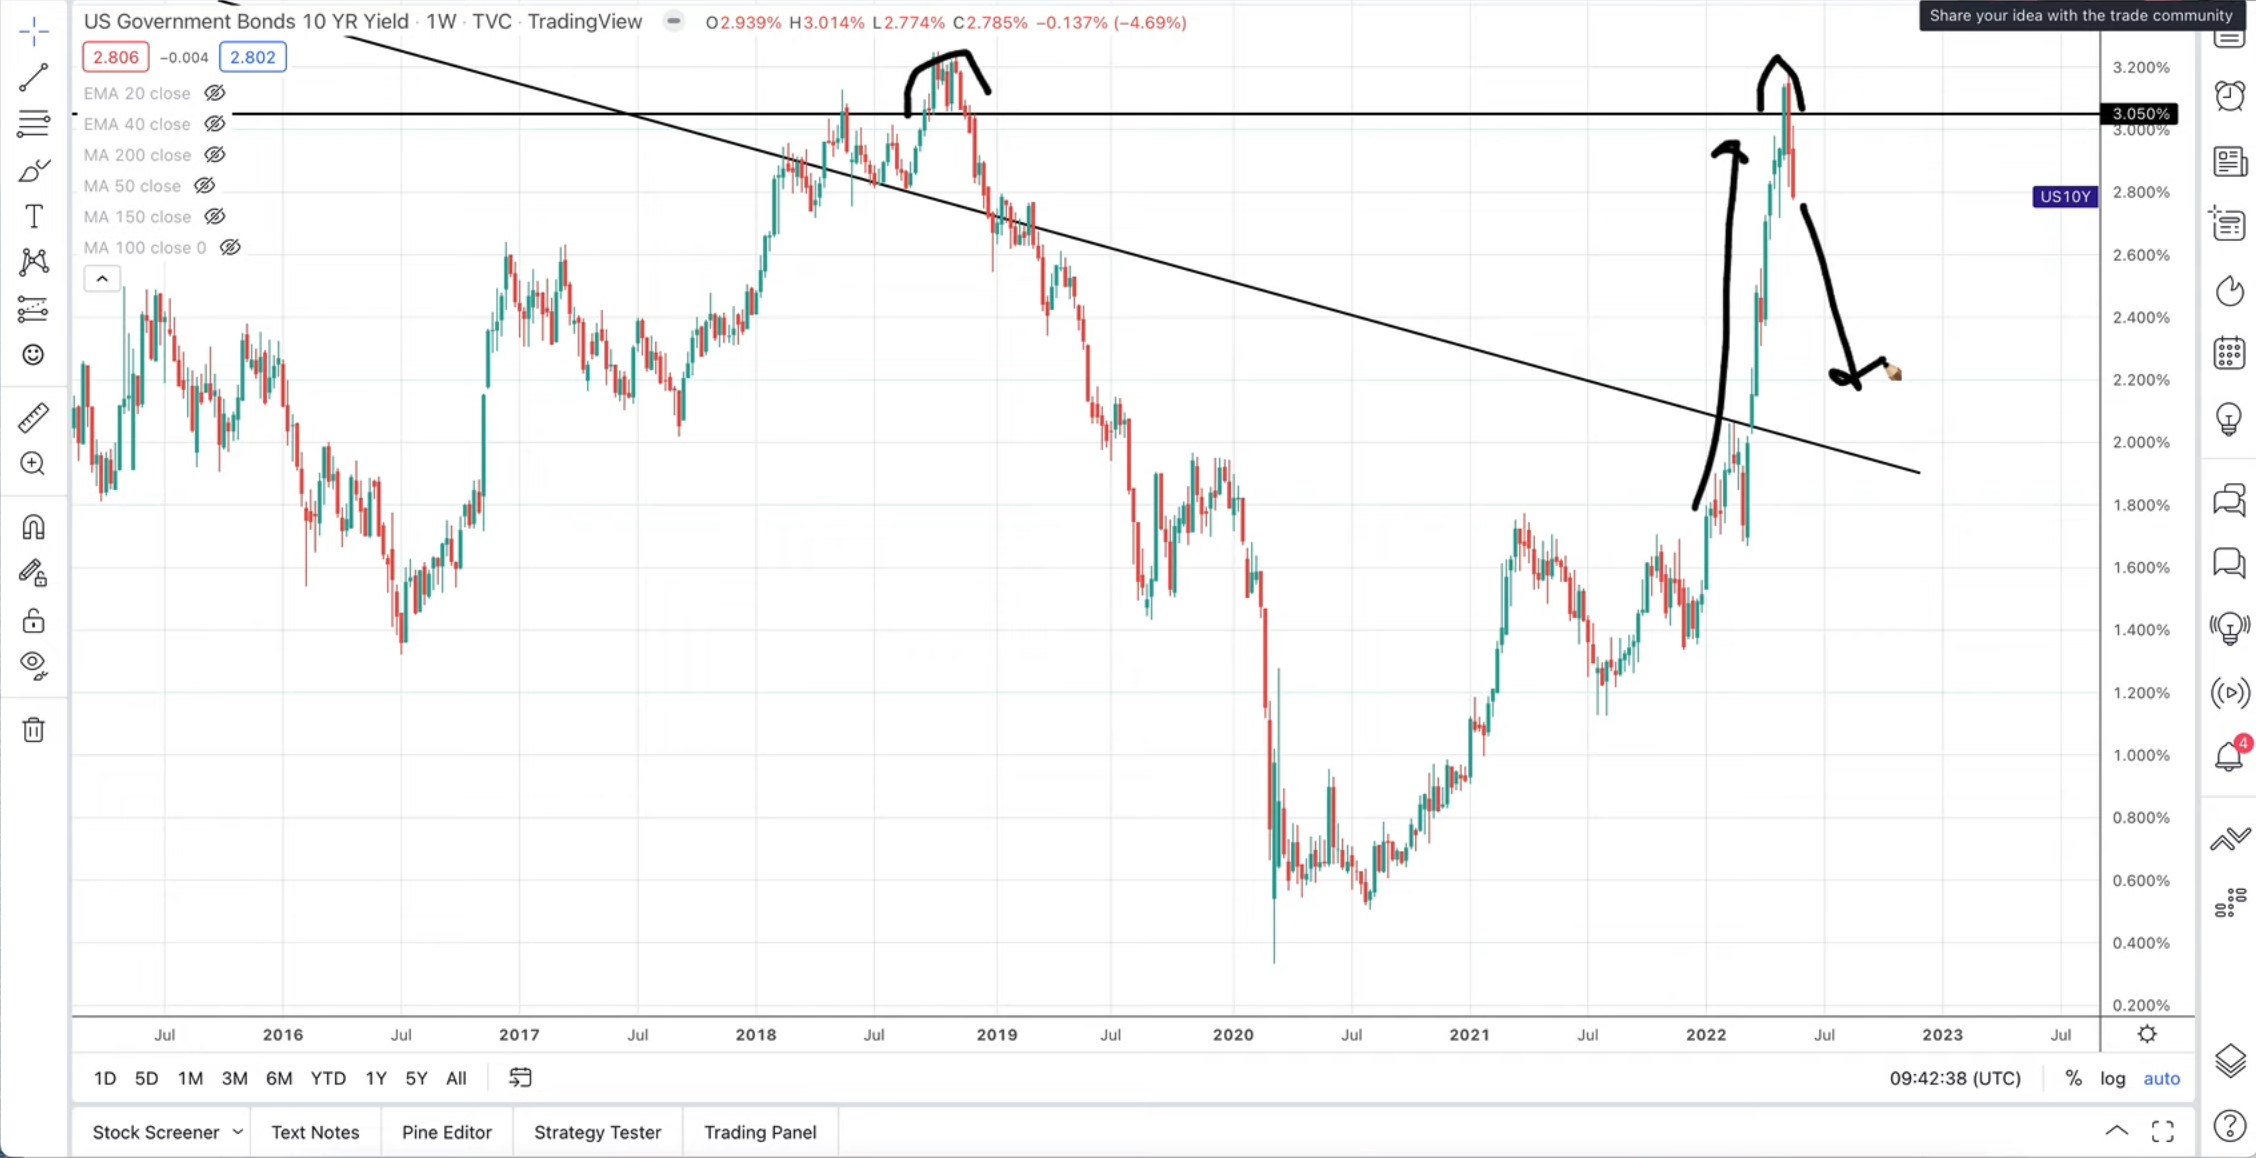
Now if you take a look at what has happened last week, you'll notice that we hit that level of resistance and we actually closed with 2 bearish candles on the 10-year yields' weekly candles.
This looks really overbought, so if this comes down — which I suspect it'll start to come down — that would signal that the market is beginning to believe that inflation has peaked, inflation is abating, so the FED doesn't have to be so aggressive. That would mark a huge change in sentiment in the markets and a strong bullish rally would be in place once we see this 10-year yield start to
break down.
So in the next couple of days, I expect a very strong rally in the S&P 500 as well as the NASDAQ.
Setting Up A Bullish Trade Using Options
So I'm going to show you how I'm going to set up a bullish trade using options.
First of all, I'm expecting a strong rally. How high do I think it's going to go?
To kind of like pinpoint my target price, I'm using some Fibonacci levels.
If you take a look at the wider wave patterns, we've got this wave down, wave up, and a wave down again. We're looking for the next wave up.
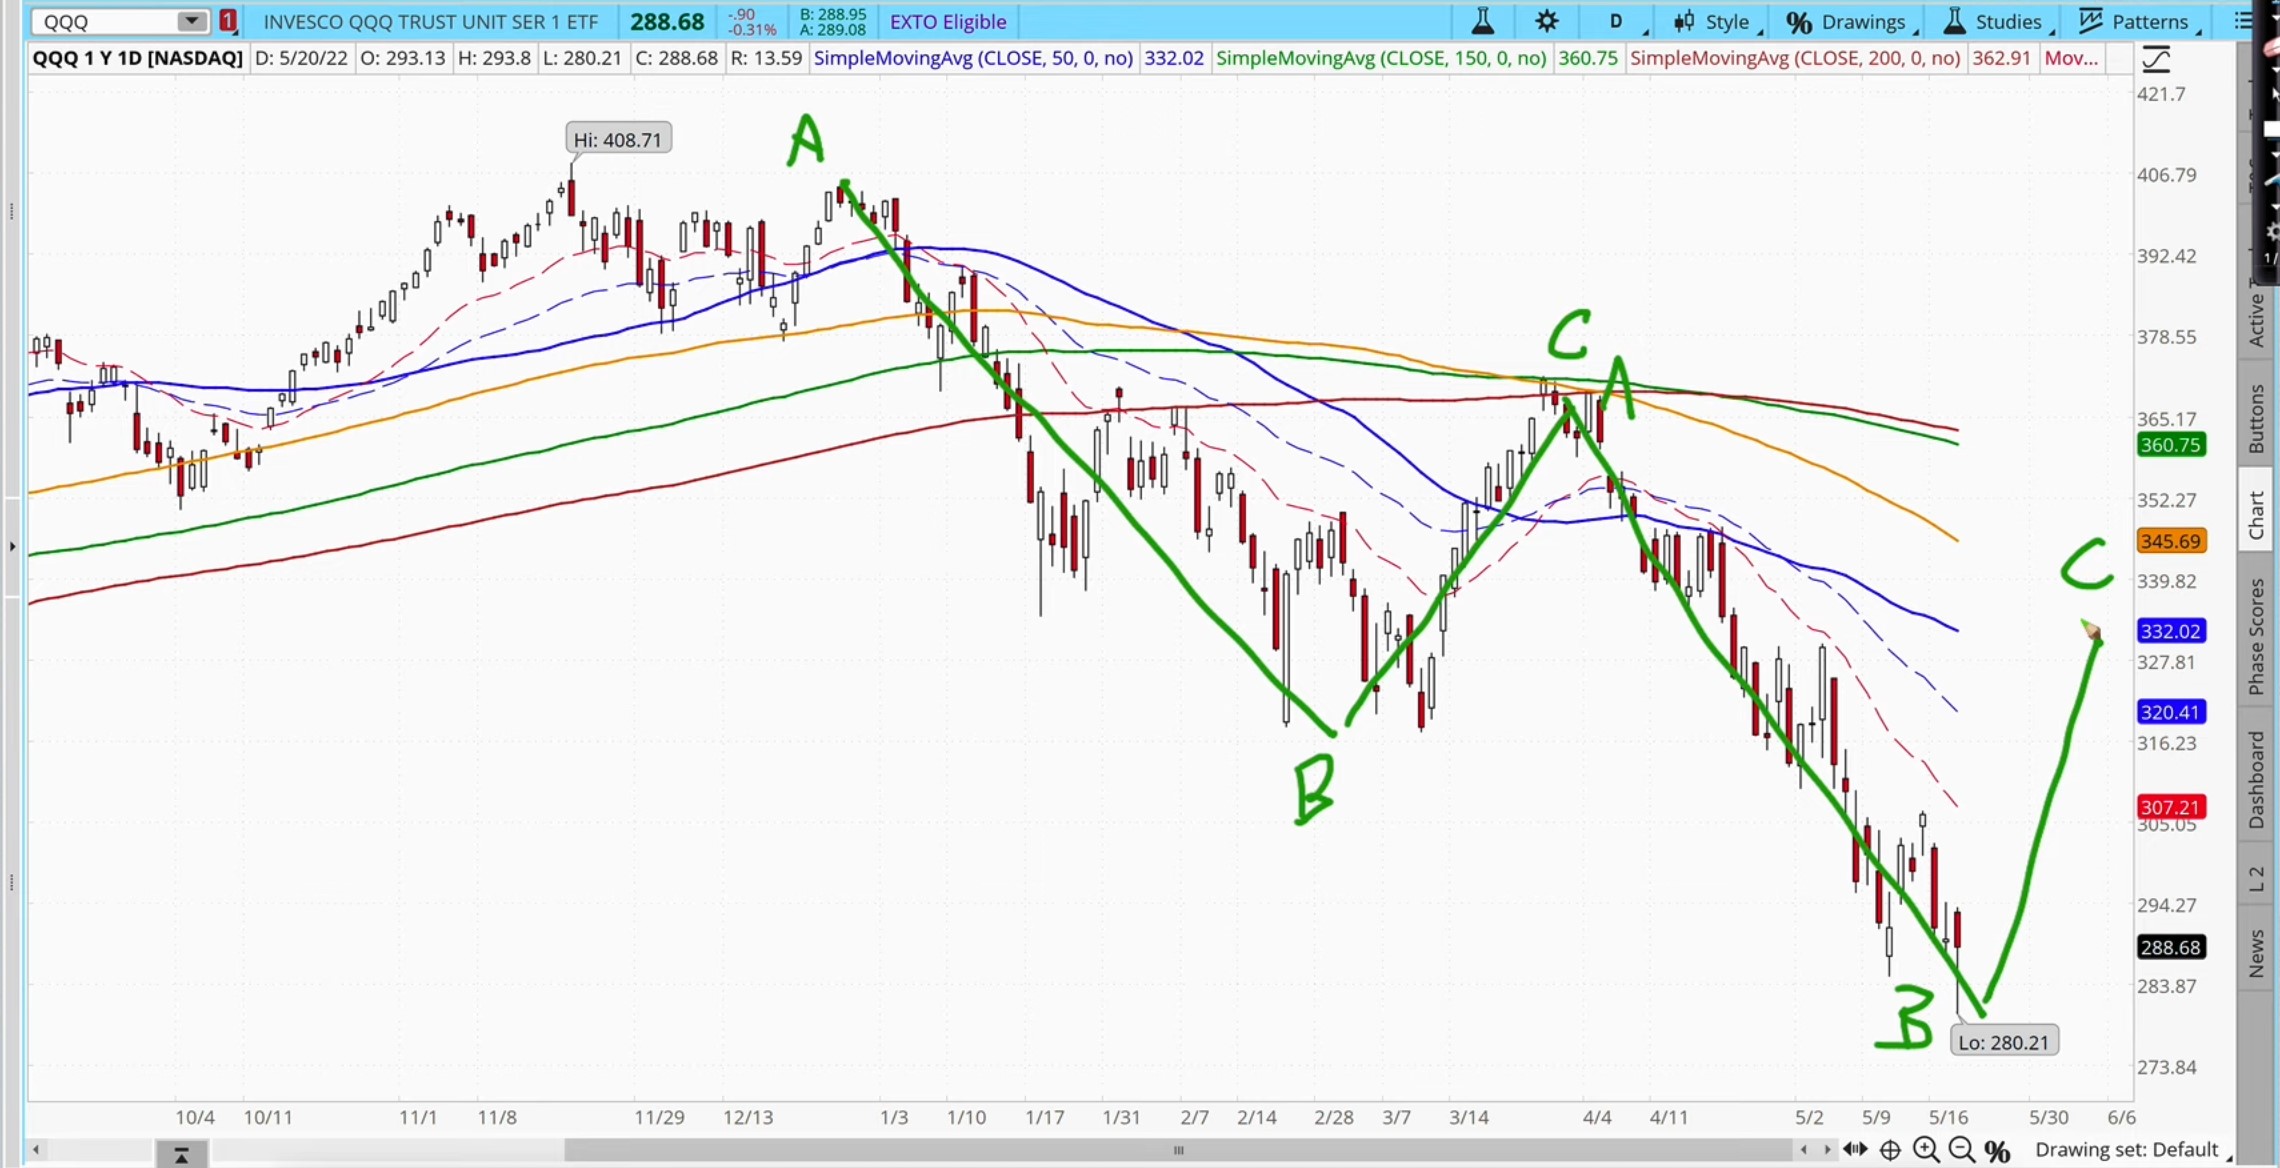
We're now looking for the latest B to C wave up.
From the first A to B, you can see that C is a FIBONACCI RETRACEMENT, and I've drawn this for you. I selected the Fibonacci Retracement tool and clicked on A and simply dragged it to B.
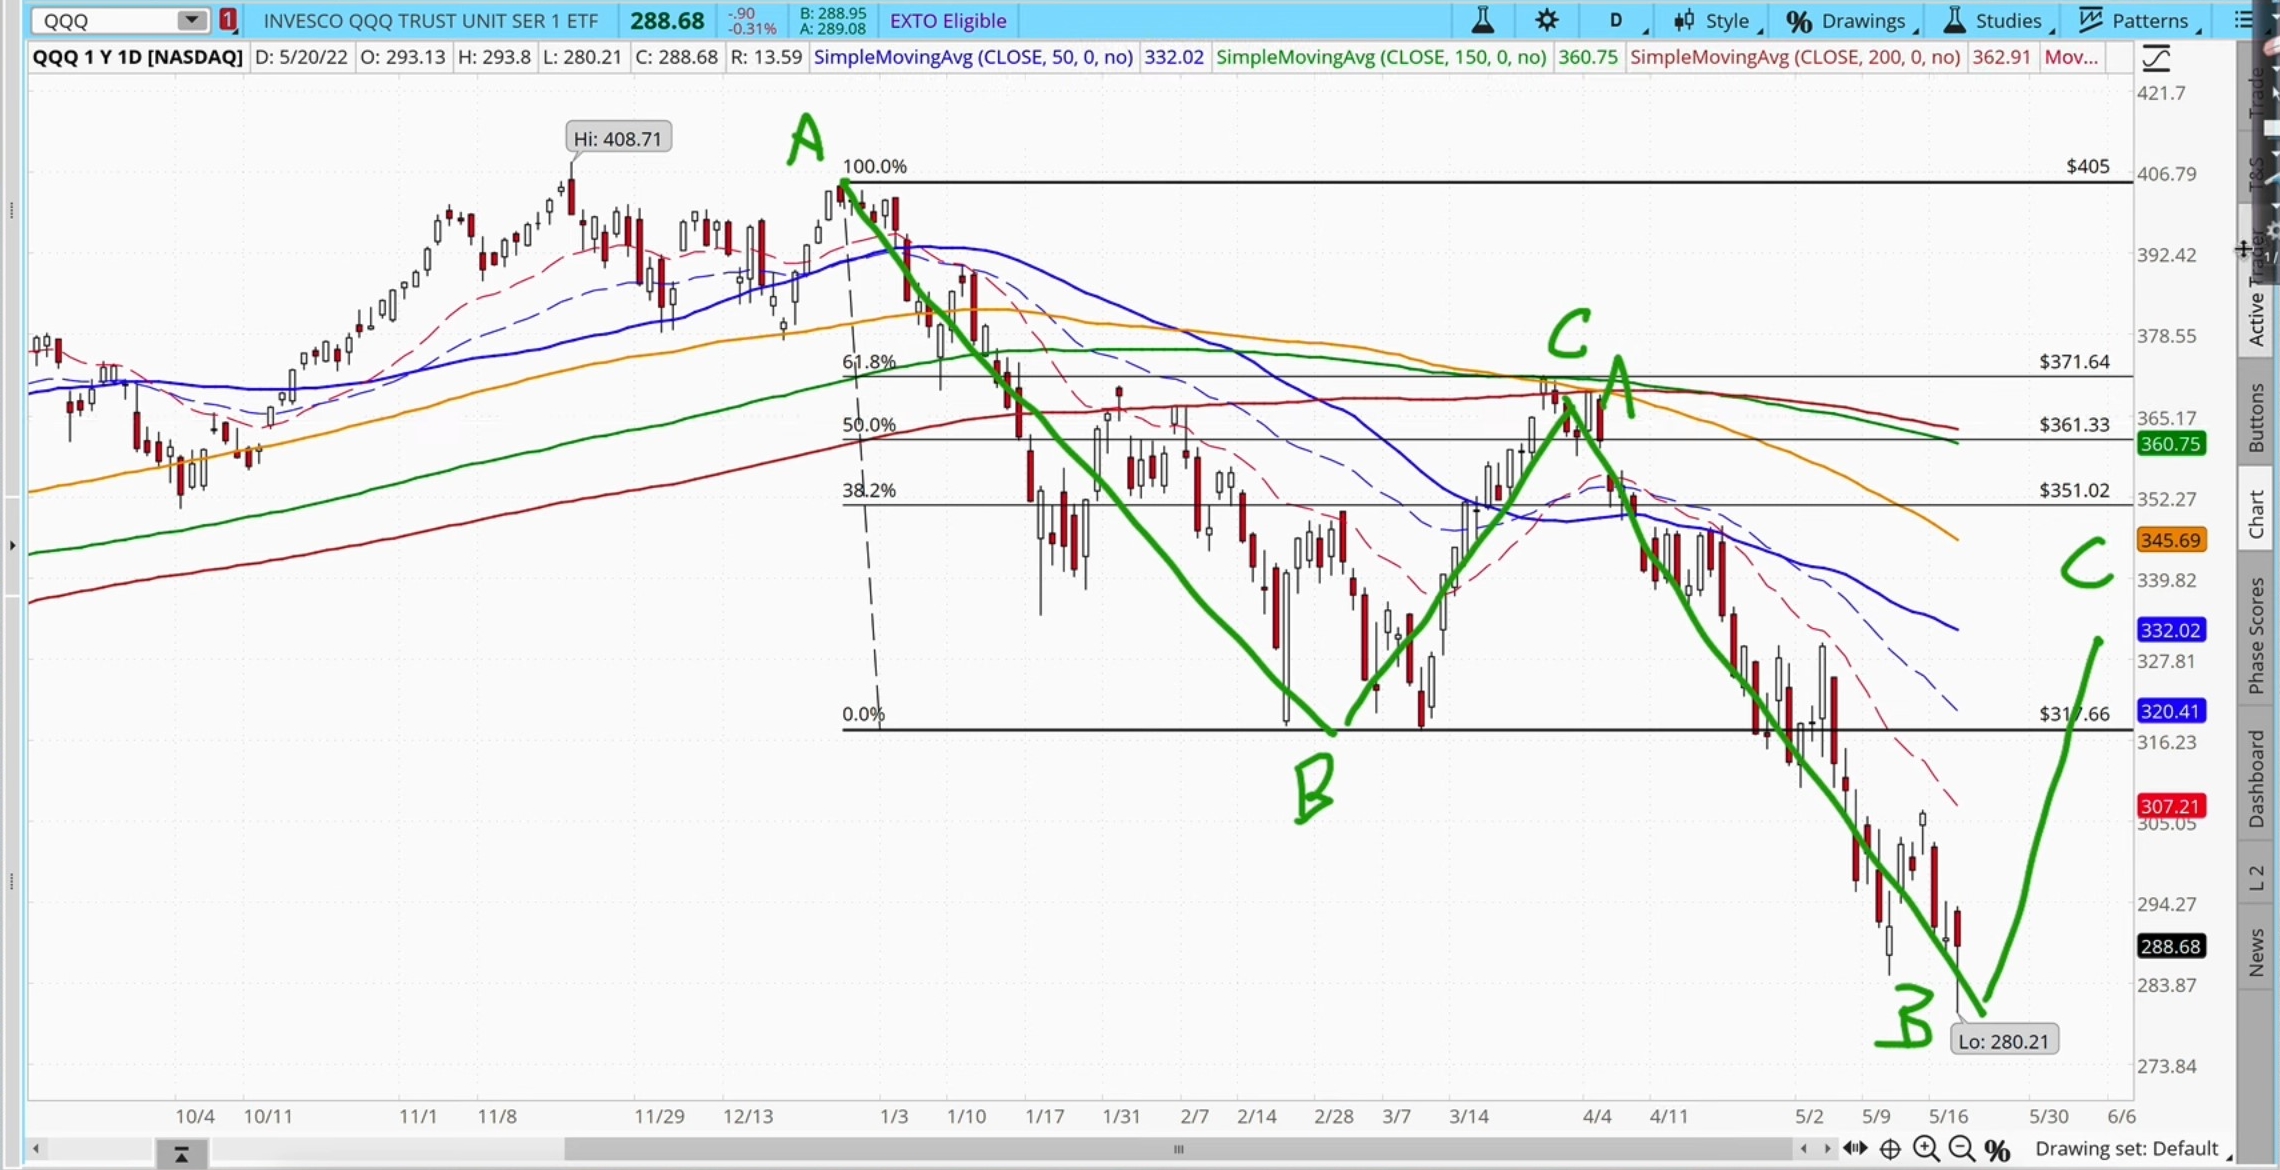
Usually, it will retrace to the 50% or 61.8% Fibonacci level.
So you can see this is a classic 61.8% retracement. Now once it retraces to C, it would then go to the next wave down — to the next A level. So how do we know that this is the bottom? Again, we can't predict for certain, but with Fibonacci, we can kind of like mix up intelligent statistical guesses.
So what we do with Fibonacci is we go to a FIBONACCI EXTENSION tool, and again we click on A, then B, and lastly C — 3 points to click this time.
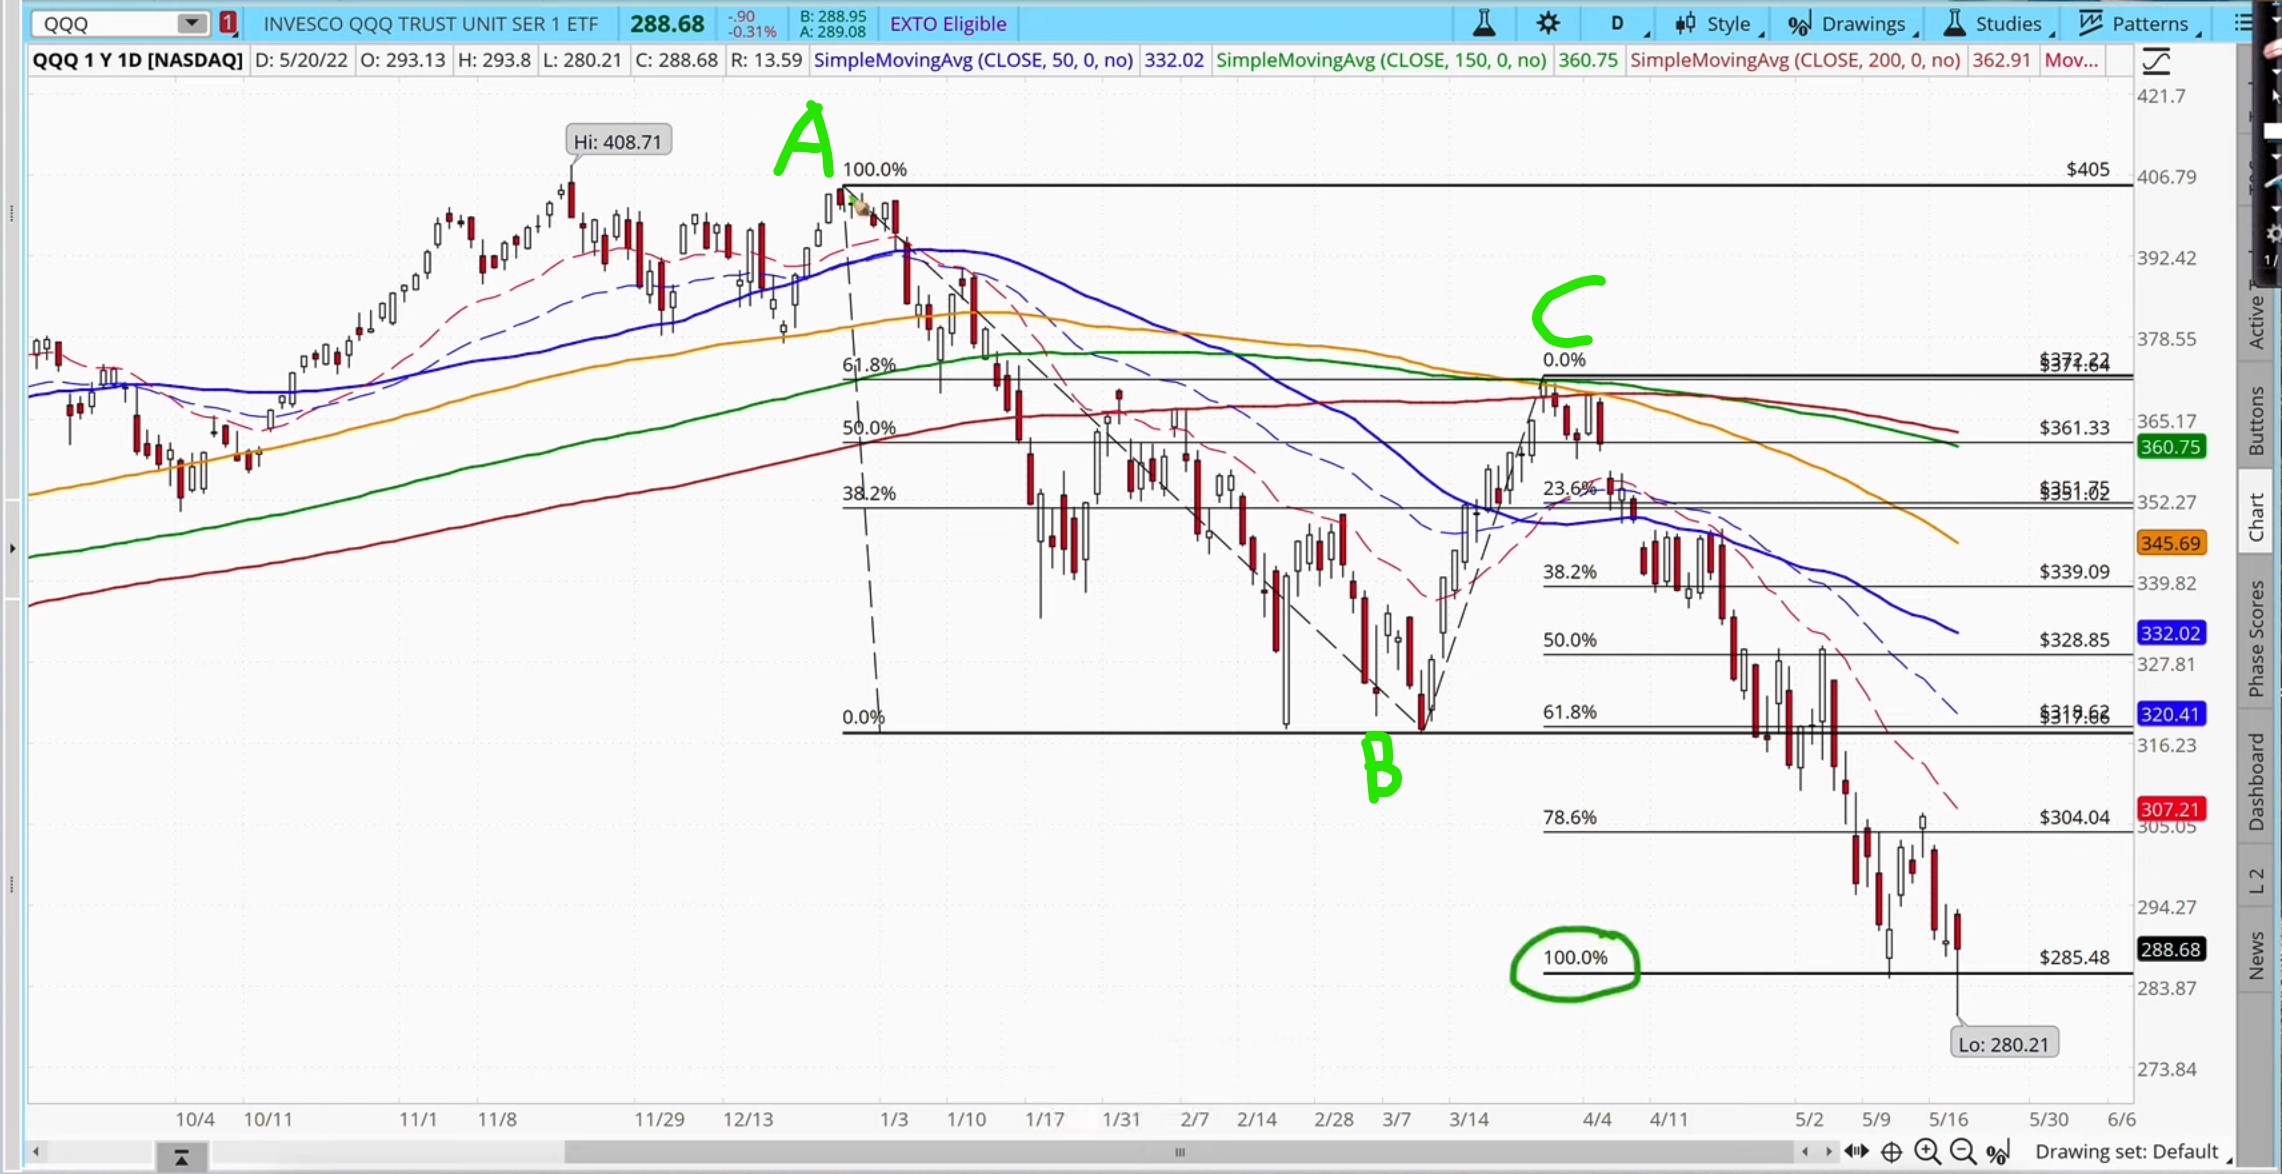
You can see this is the 100% level. So usually after an A, B, and C, it will then reach the 100% target, which is exactly where we are right now. So this gives me an additional pattern of confluence that this is the end of this wave pattern because it's at 100% level — or at least near the end.
So the question is now "Where is it going to retrace to?"
So once again we apply a Fibonacci Retracement.
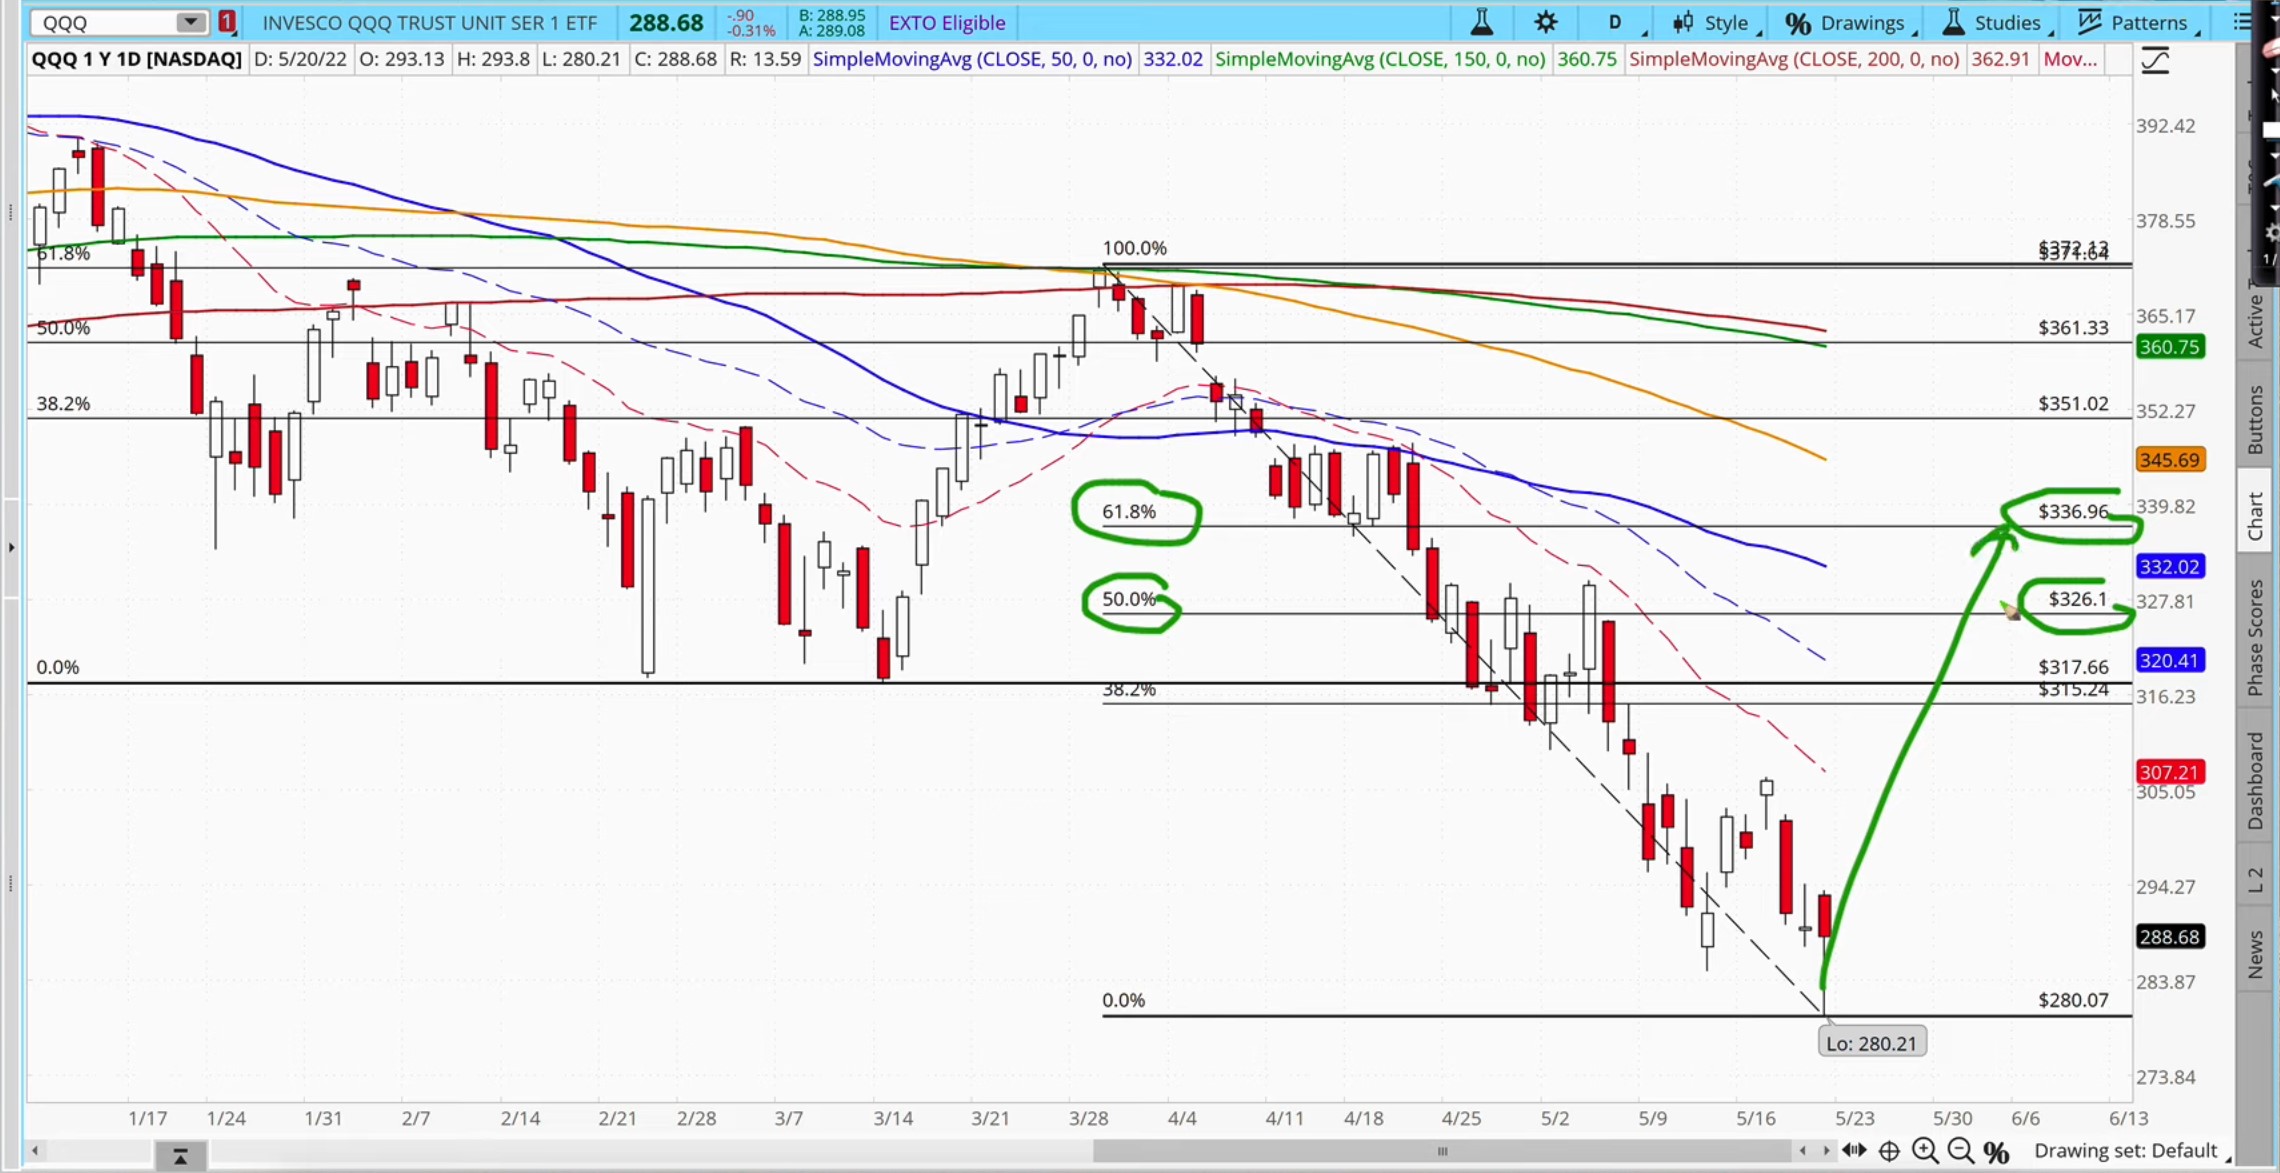
All right so we are looking at a target of 50% or 61.8%. This is our target range of where we think the market is going to go — between $326 to $336. To be conservative I'm going to target $326, and I'm going to show you how I can set up a trade to target that bounce in the QQQ.
So if I expect that there's going to be a strong bounce in the market whether the SPY or the QQQ, how can I trade this?
Now what's very important to remember is that as a trader you can never be right all the time. I
don't expect to be right all the time.
It's not whether you're right or wrong — it's how much you make when you're right and how much you lose if you are wrong.
Whenever I set up a trade, I will ensure that I always risk $1 to make more than $1, so I risk $1 to make $2 or $4. Even if I'm wrong, heck, I lose just 1 buck, but if I'm right, I make $2-$4. When you do that consistently as a trader, even if you're right only half the time, you are still profitable.
Trading is all about money management — it's all about controlling your risk to reward ratios.
You can't predict the market 100%. You can only look at what we call high probability entries. You must always know when to cut your losses and get out when it's not moving in the direction that you anticipate.
So I'm gonna show you how I swing trade using options.
I love to use options because with options, I limit my risk but I have got great rewards. Many people like to just buy call options, but I don't, because I think if you just buy call options, they get very very
expensive.
So I'm gonna show you two methods that we teach in our classes.
One method is what we call a BULL CALL SPREAD, and another method is known as a BACK RATIO SPREAD, and it's pretty interesting, so this is how it goes.
BULL CALL SPREAD
With a bull call spread, I'm going to buy a call option just above the current price.
Right now the price is $289. Of course, when the market opens Monday, it could go higher so I have to adjust it when the market opens.
So I'm going to buy a call option just above that, so for example, I could buy a call option at say $293 for example — just slightly out of the money, and simultaneously after I buy the call option, I will sell another call option at my target price which is about $325-$326 somewhere here so over here I will
sell a call option.
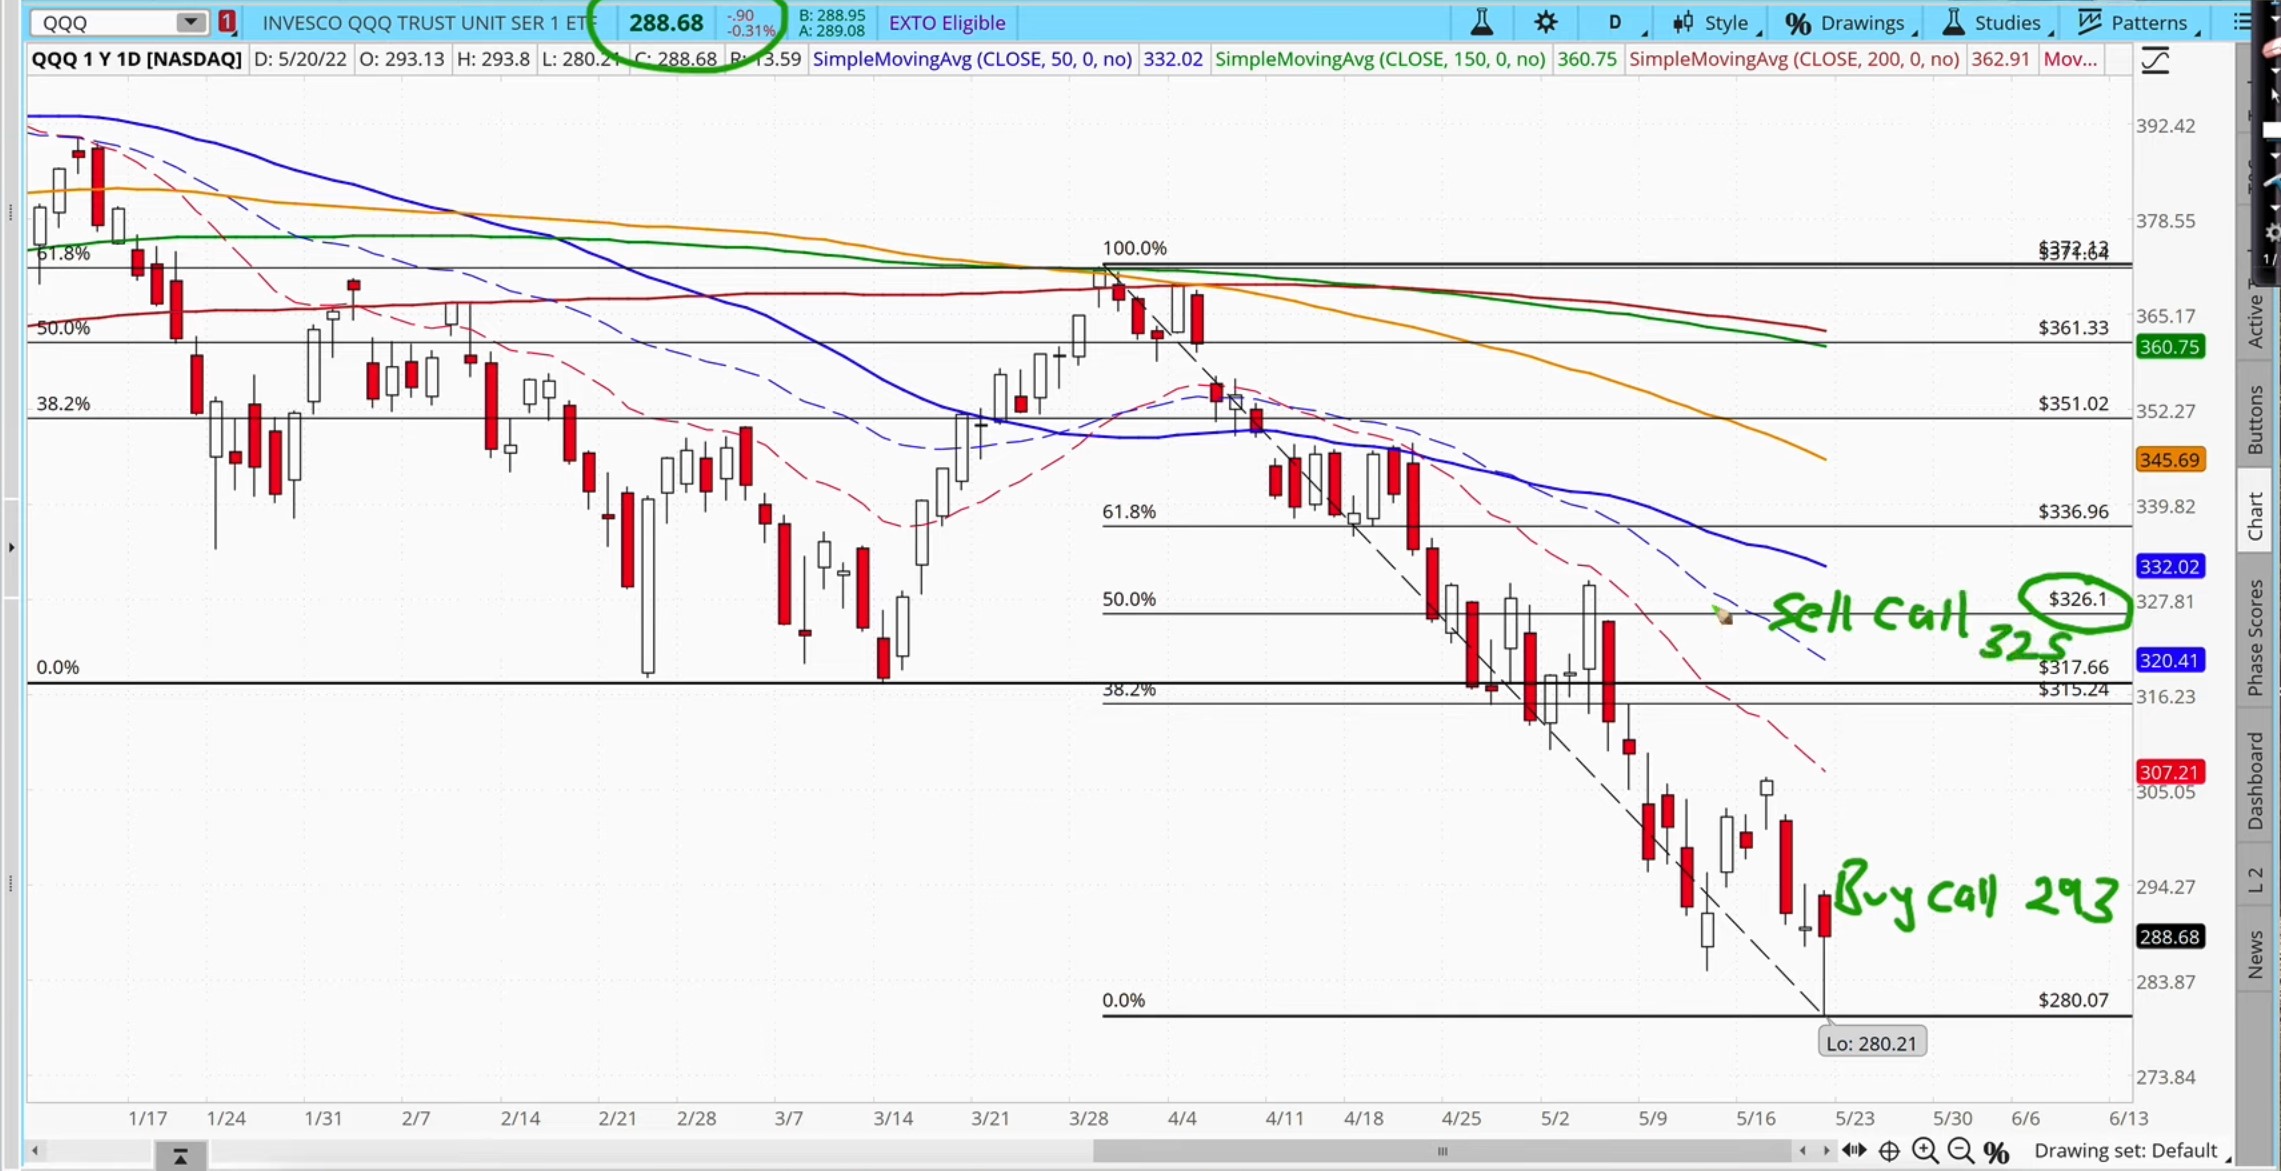
So why do I want to sell a call option and buy a call option?
Because when I sell a call option, I collect money — I collect the premium that will help to pay for the call which I buy, so this lowers my cost and makes it a lot cheaper than just buying a call option.
First, I have to decide on the expiration date. I will just choose 30 days which is pretty standard for swing trades. I'm going to look for a $293 call option, and I'm going to right-click and buy vertical.
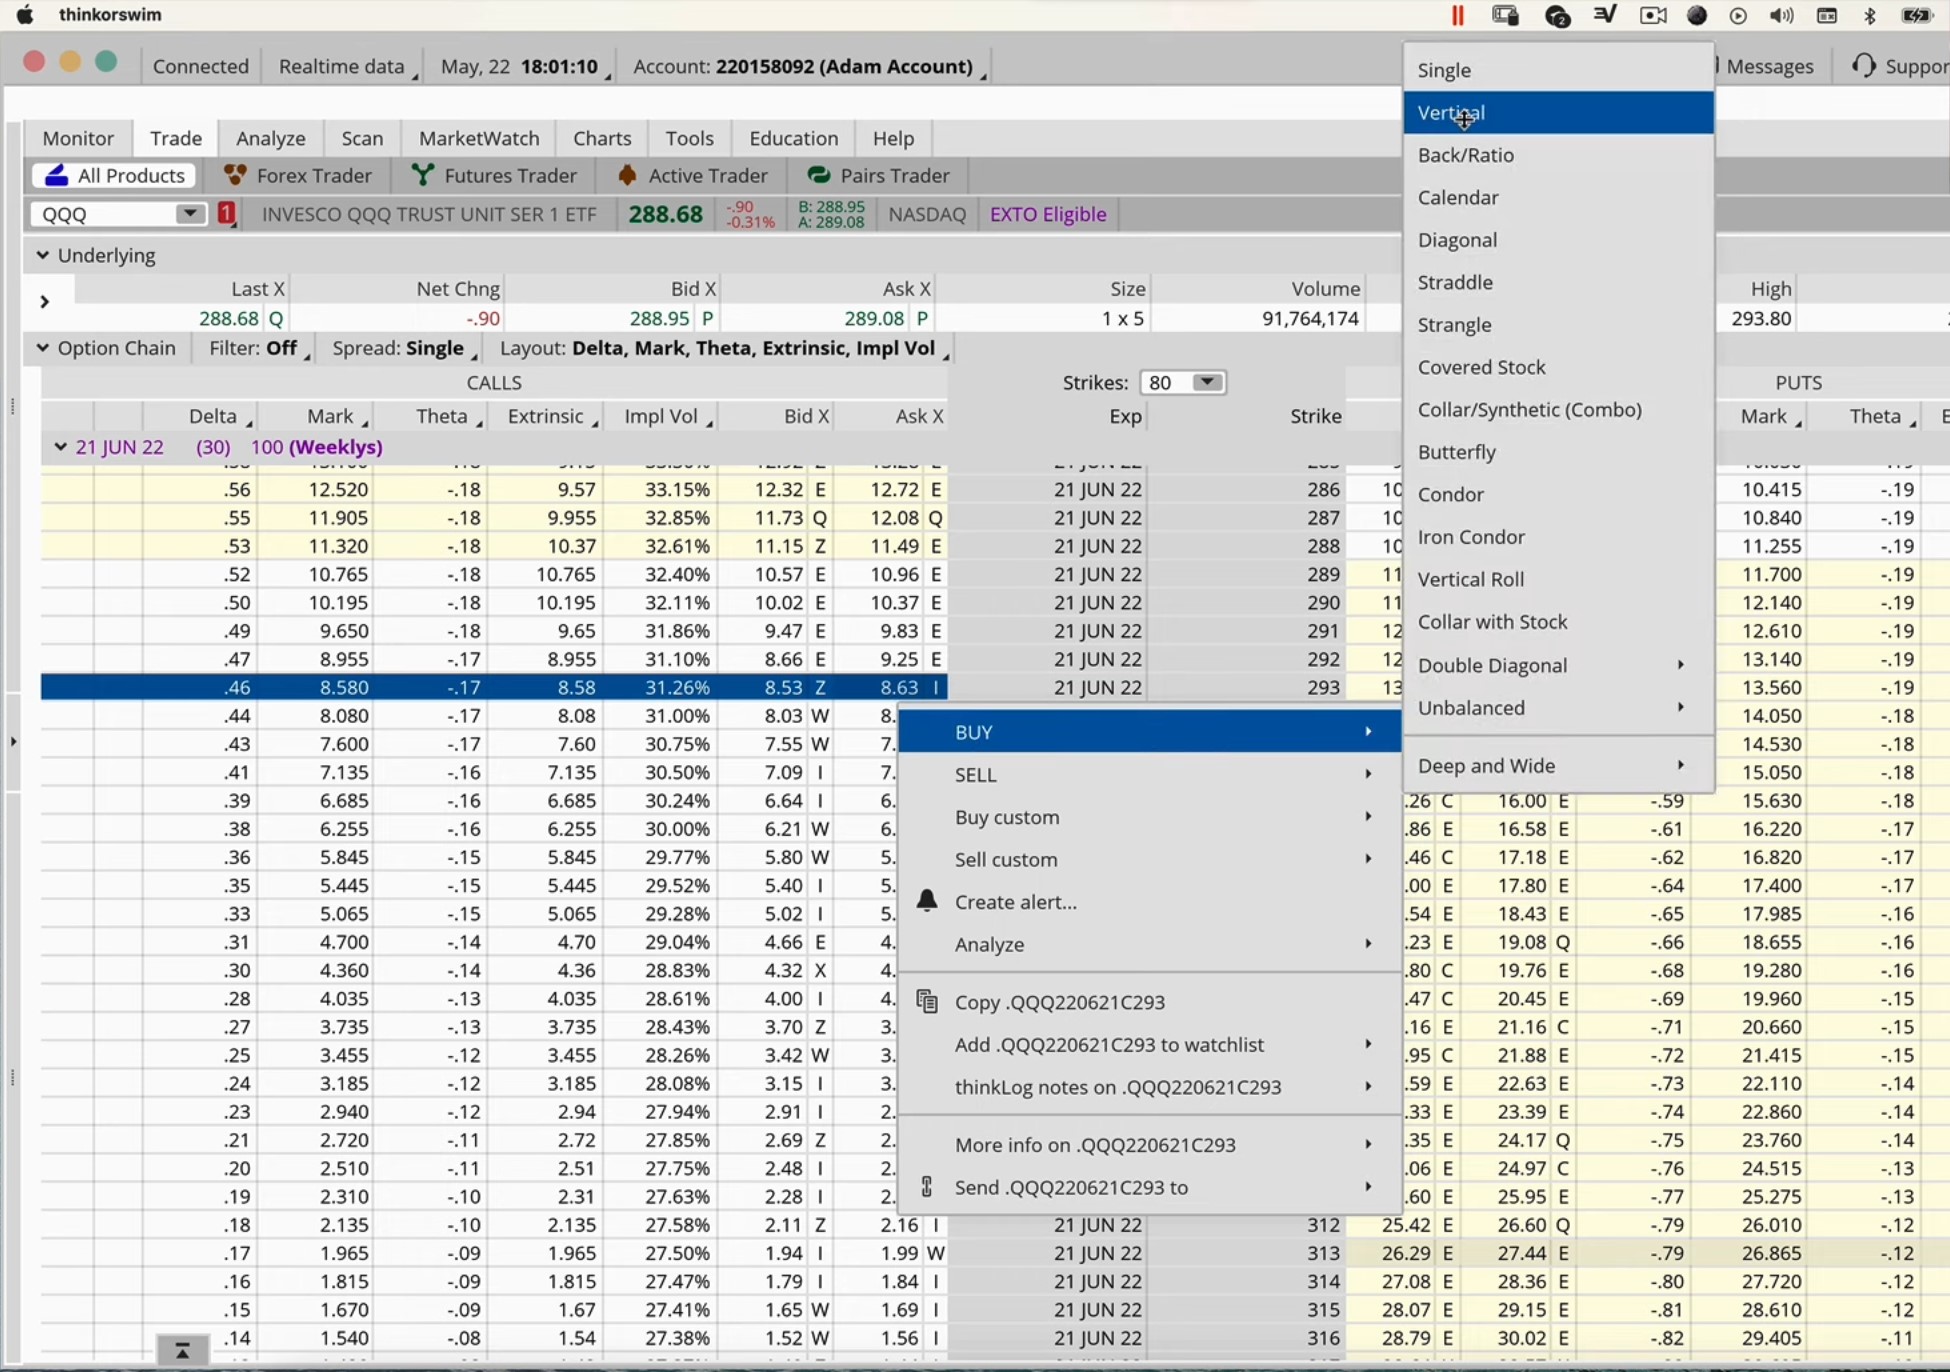
Vertical means a vertical spread. So click on that. I'm going to buy a call option at $293, and I'm going to sell a call option at my target price of $325.
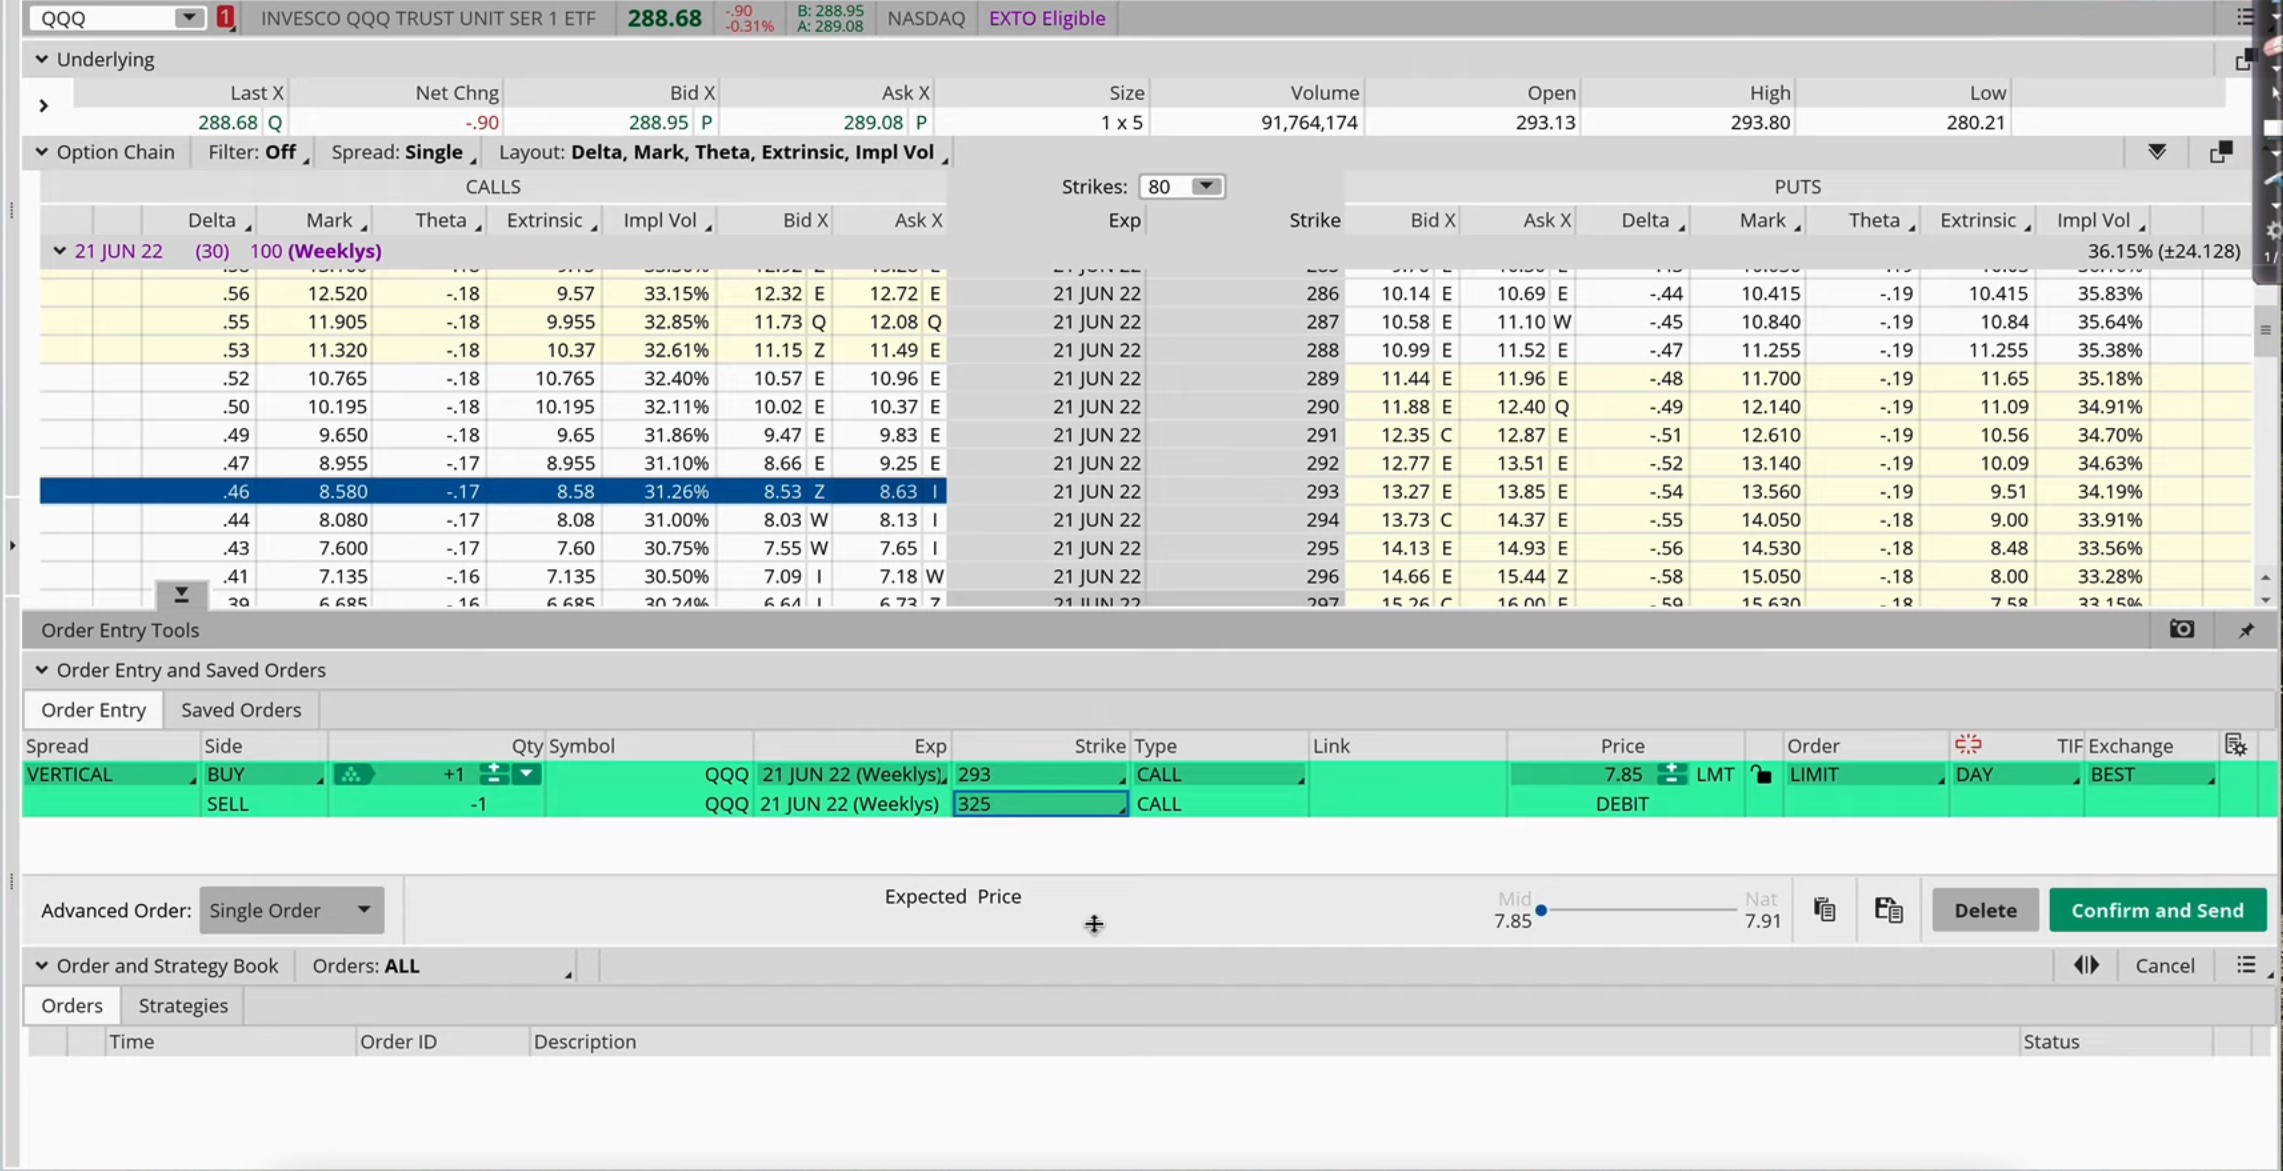
So how much would this trade cost me?
It will cost me $7.85. One contract is a hundred shares so multiply by 100, that would be $785 — that's the total cost of this trade, and that's also the maximum loss.
The most I can lose is $785. If I click on ''CONFIRM', you can see that my maximum loss is $785 if the market drops and my call options expire worthlessly, but if it goes up to my target price, I could make a maximum profit of $2,415.
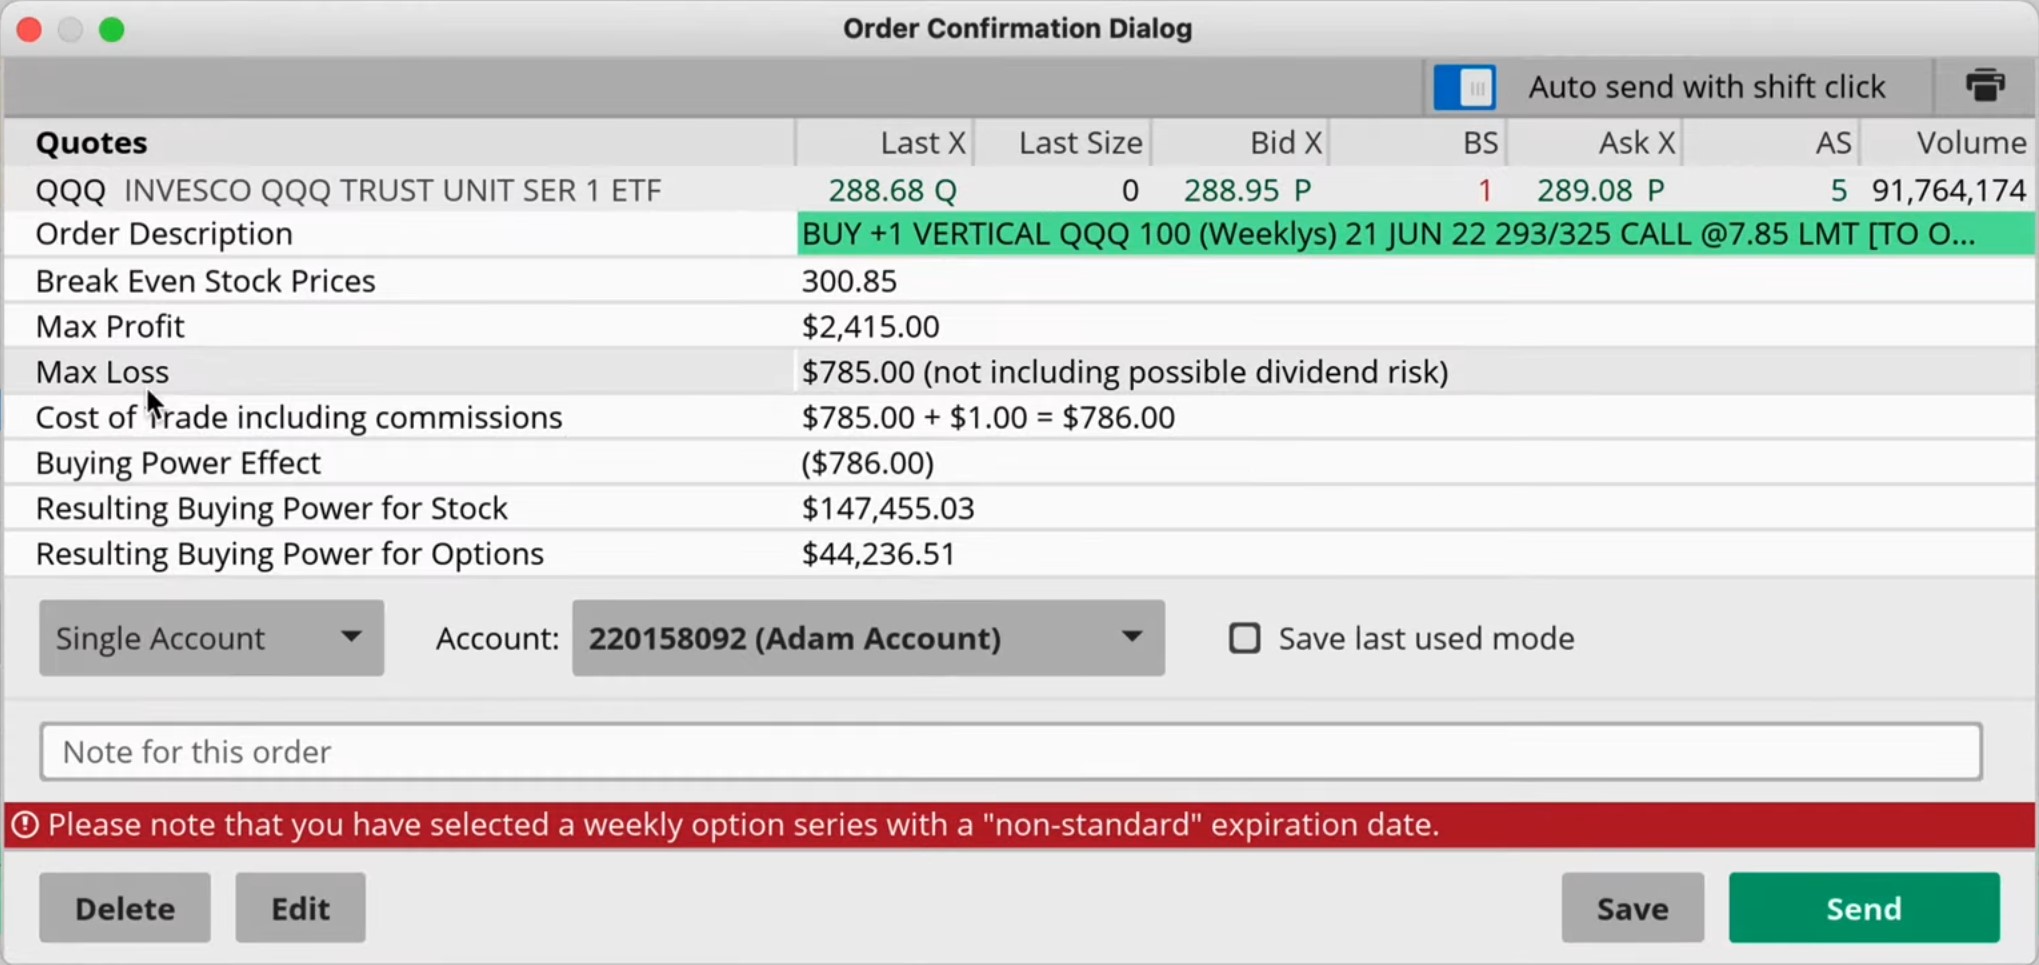
So in other words, what's my risk to reward ratio?
I'm risking $785 to make $2,415. I'm essentially risking $1 to make $3. Is that a good trade to risk $1 to make $3?
Not bad right?
So again, if I can just do this a few times, even if I'm only right half the time, I'm still very profitable.
Now some of you could be thinking, "But Adam, you know I could lose $785, that's a lot of money for me. It's too big!"
Don't worry, I'm going to show you another technique next time where it's a lot lower.
What The Trade Looks Like
I'm gonna show you the profit and loss chart for this trade.
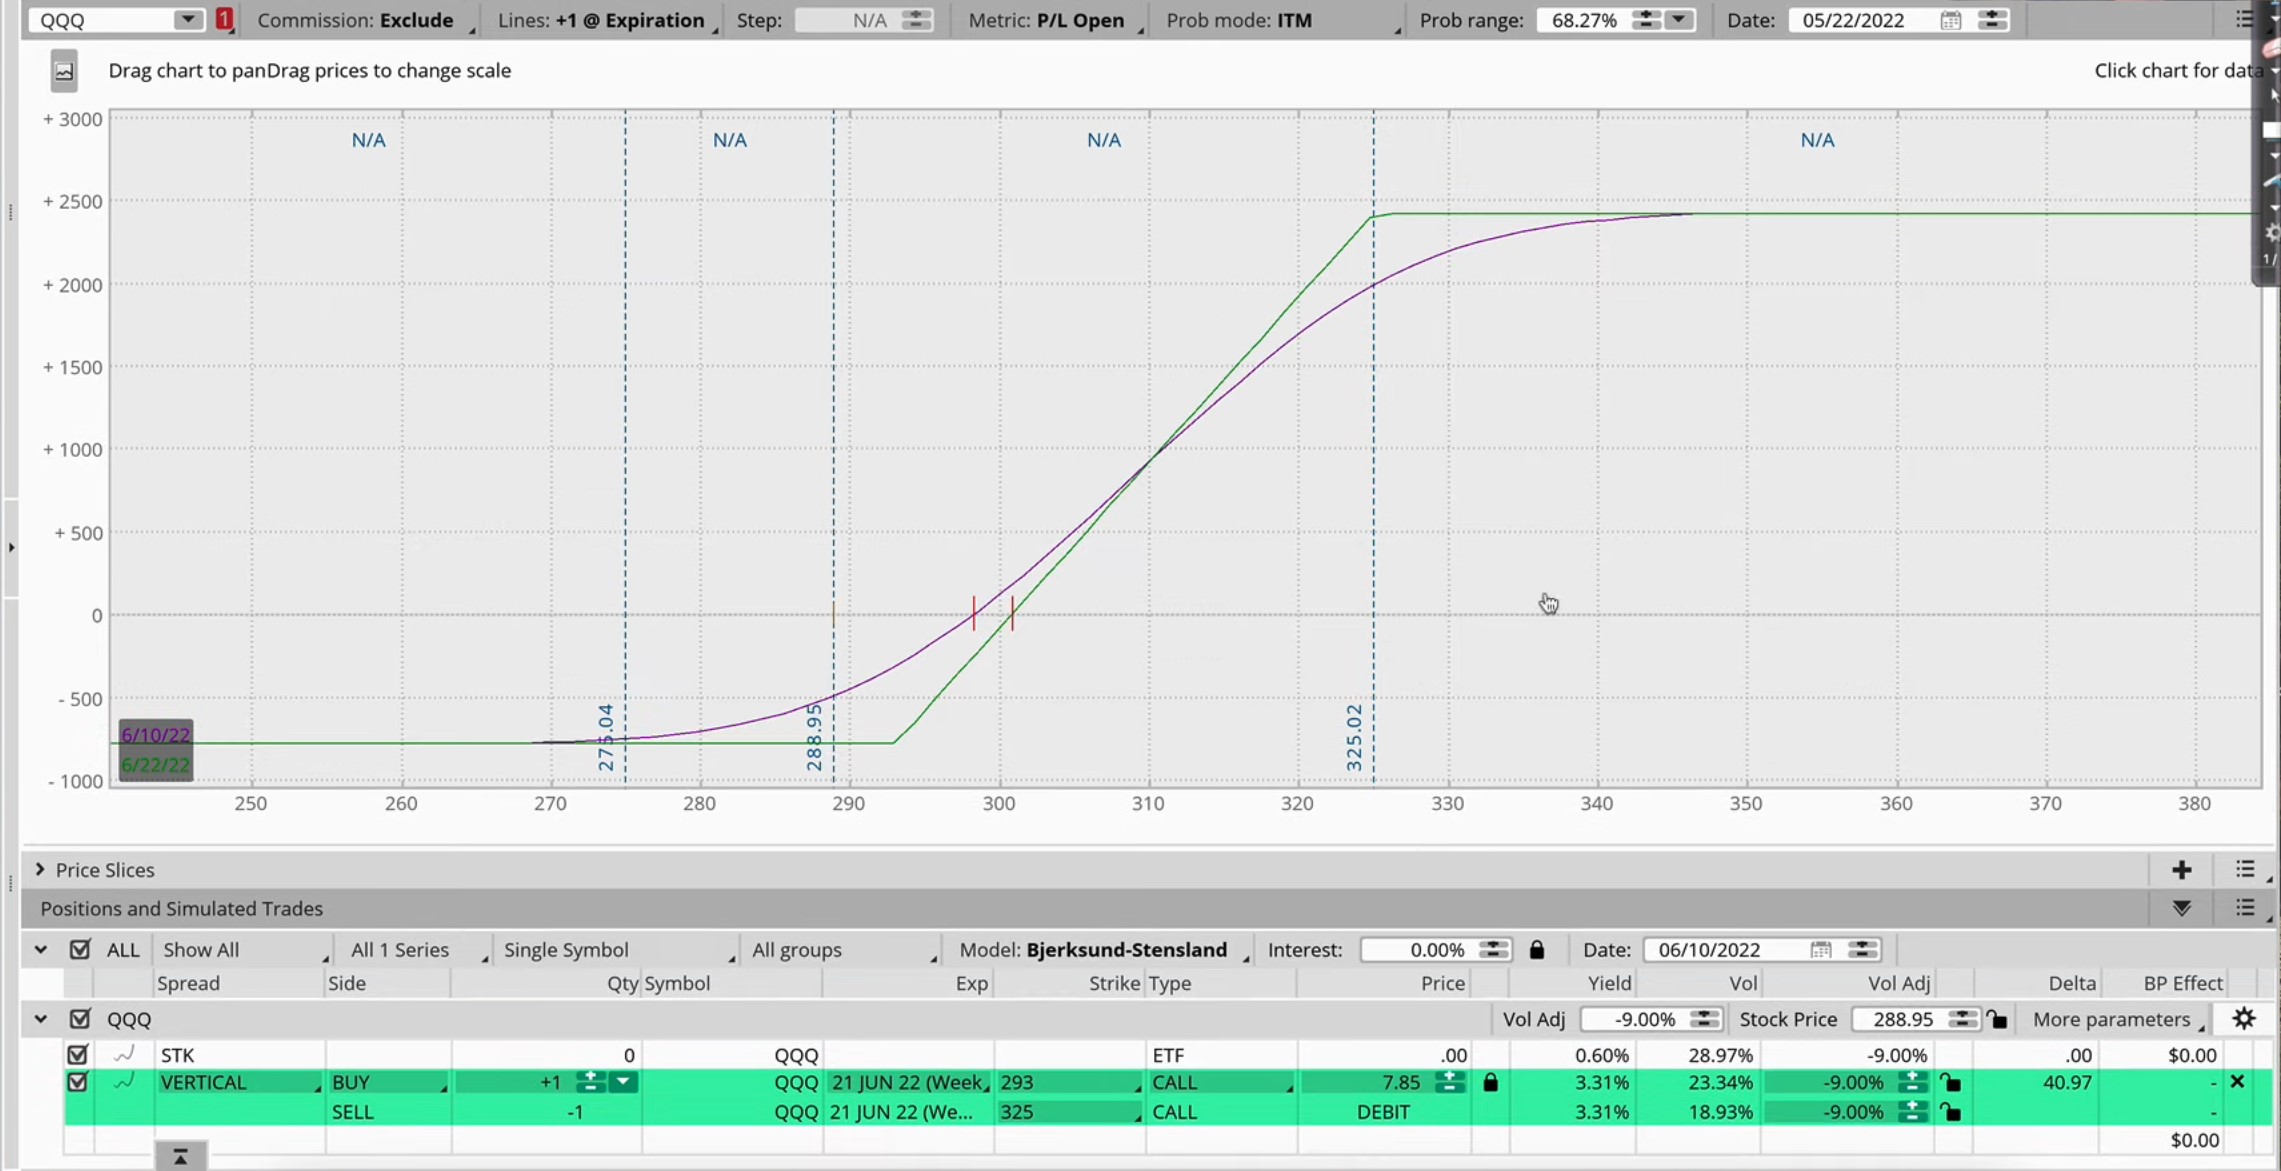
This is the profit and loss chart. Now the date today is the 22nd of May, so if I enter the trade tomorrow it'll be the 23rd of May. I'm going to go to the 23rd of May on the chart below.
So over here you can see on the Y-axis we have the profit and loss. Below zero, you're losing money.
On the X-axis, you have got the stock price. So the current stock price is at about $289, and my target price is for it to go to $325 that's my target price. If it drops below the recent swing low I will cut loss, so my cut loss point will be at $275.
So you see two lines. The green line is what happens at expiration. The purple line that you see is the profit and loss based on the date.
I'm going to assume that the market is going to move up within the next 20 days. So I'm gonna shift this chart to about 20 days later, roughly to about 10 of June.
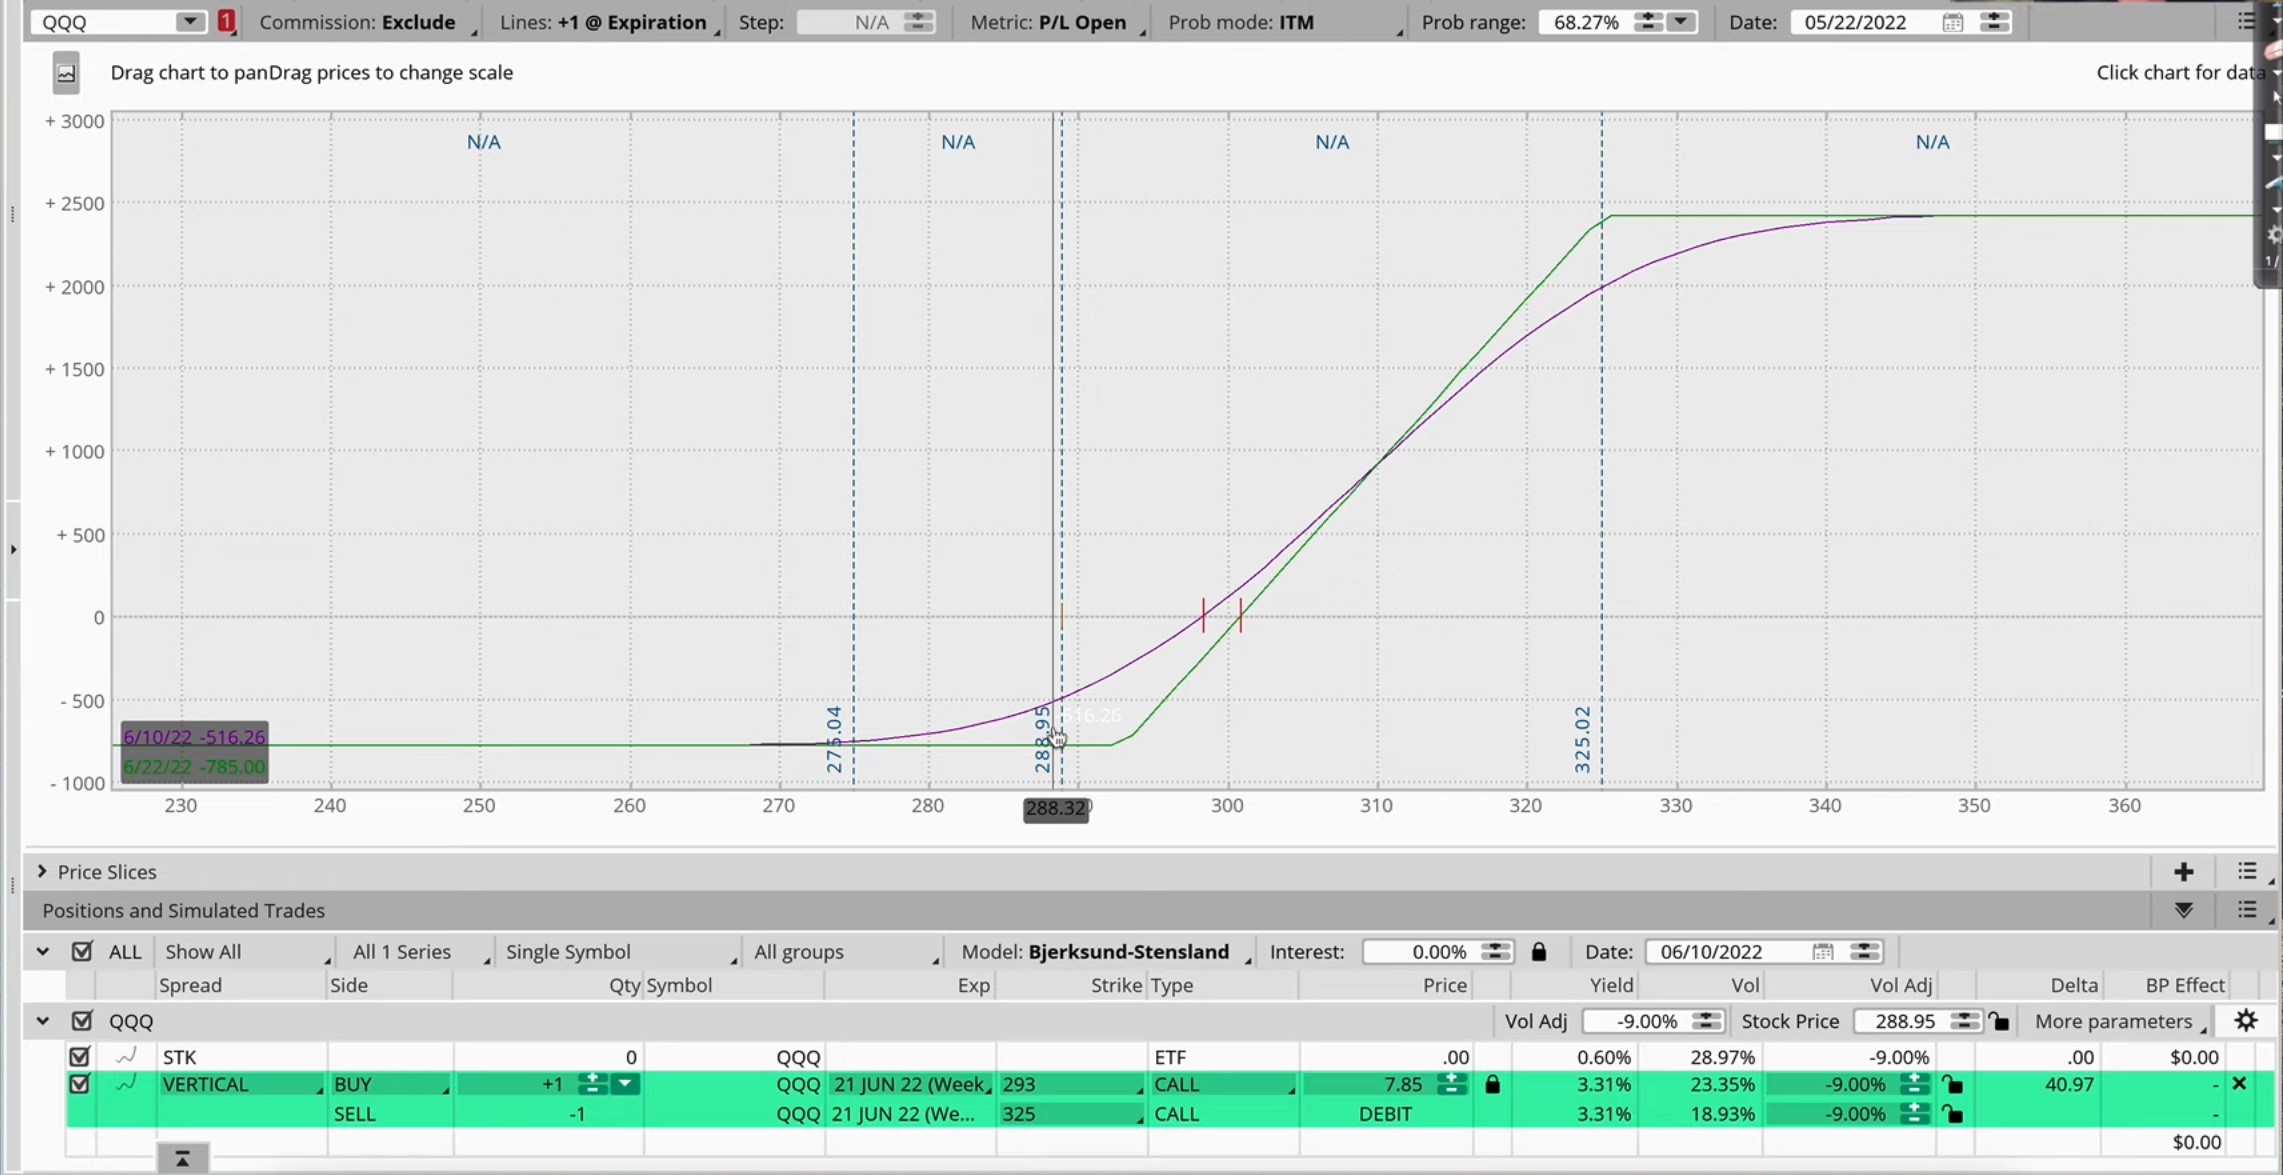
Notice what happens to the purple line when I go on the 10th of June. You can see that it shifts down slightly.
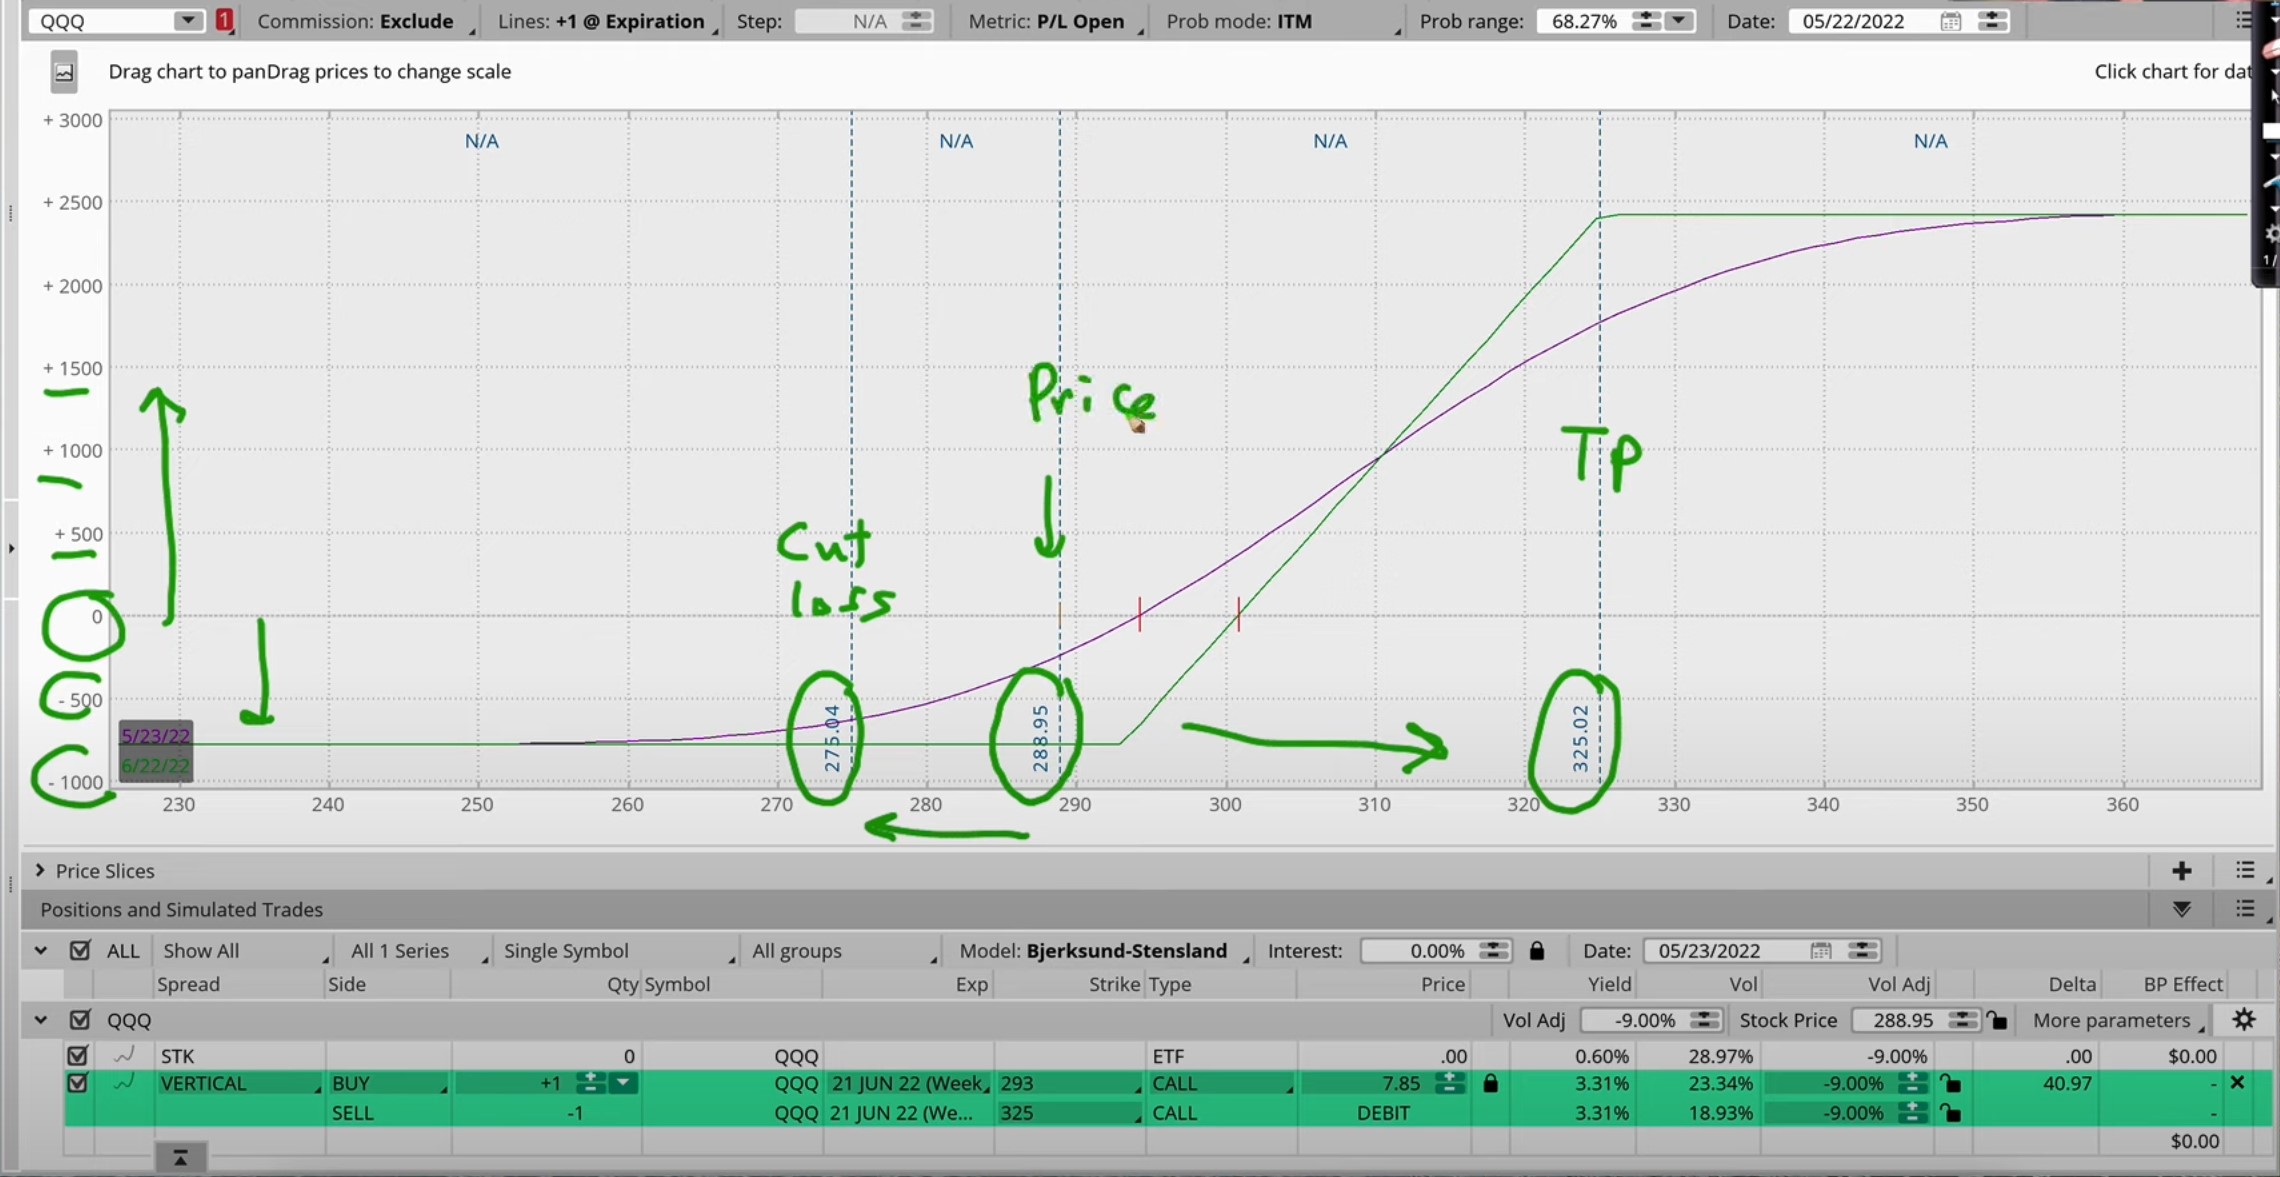
So I can see that 20 days from now if the market doesn't move, do I lose money?
Yes, I do lose money. How do I see how much I would lose?
Now take a look at this box on the bottom left and look at the purple number.
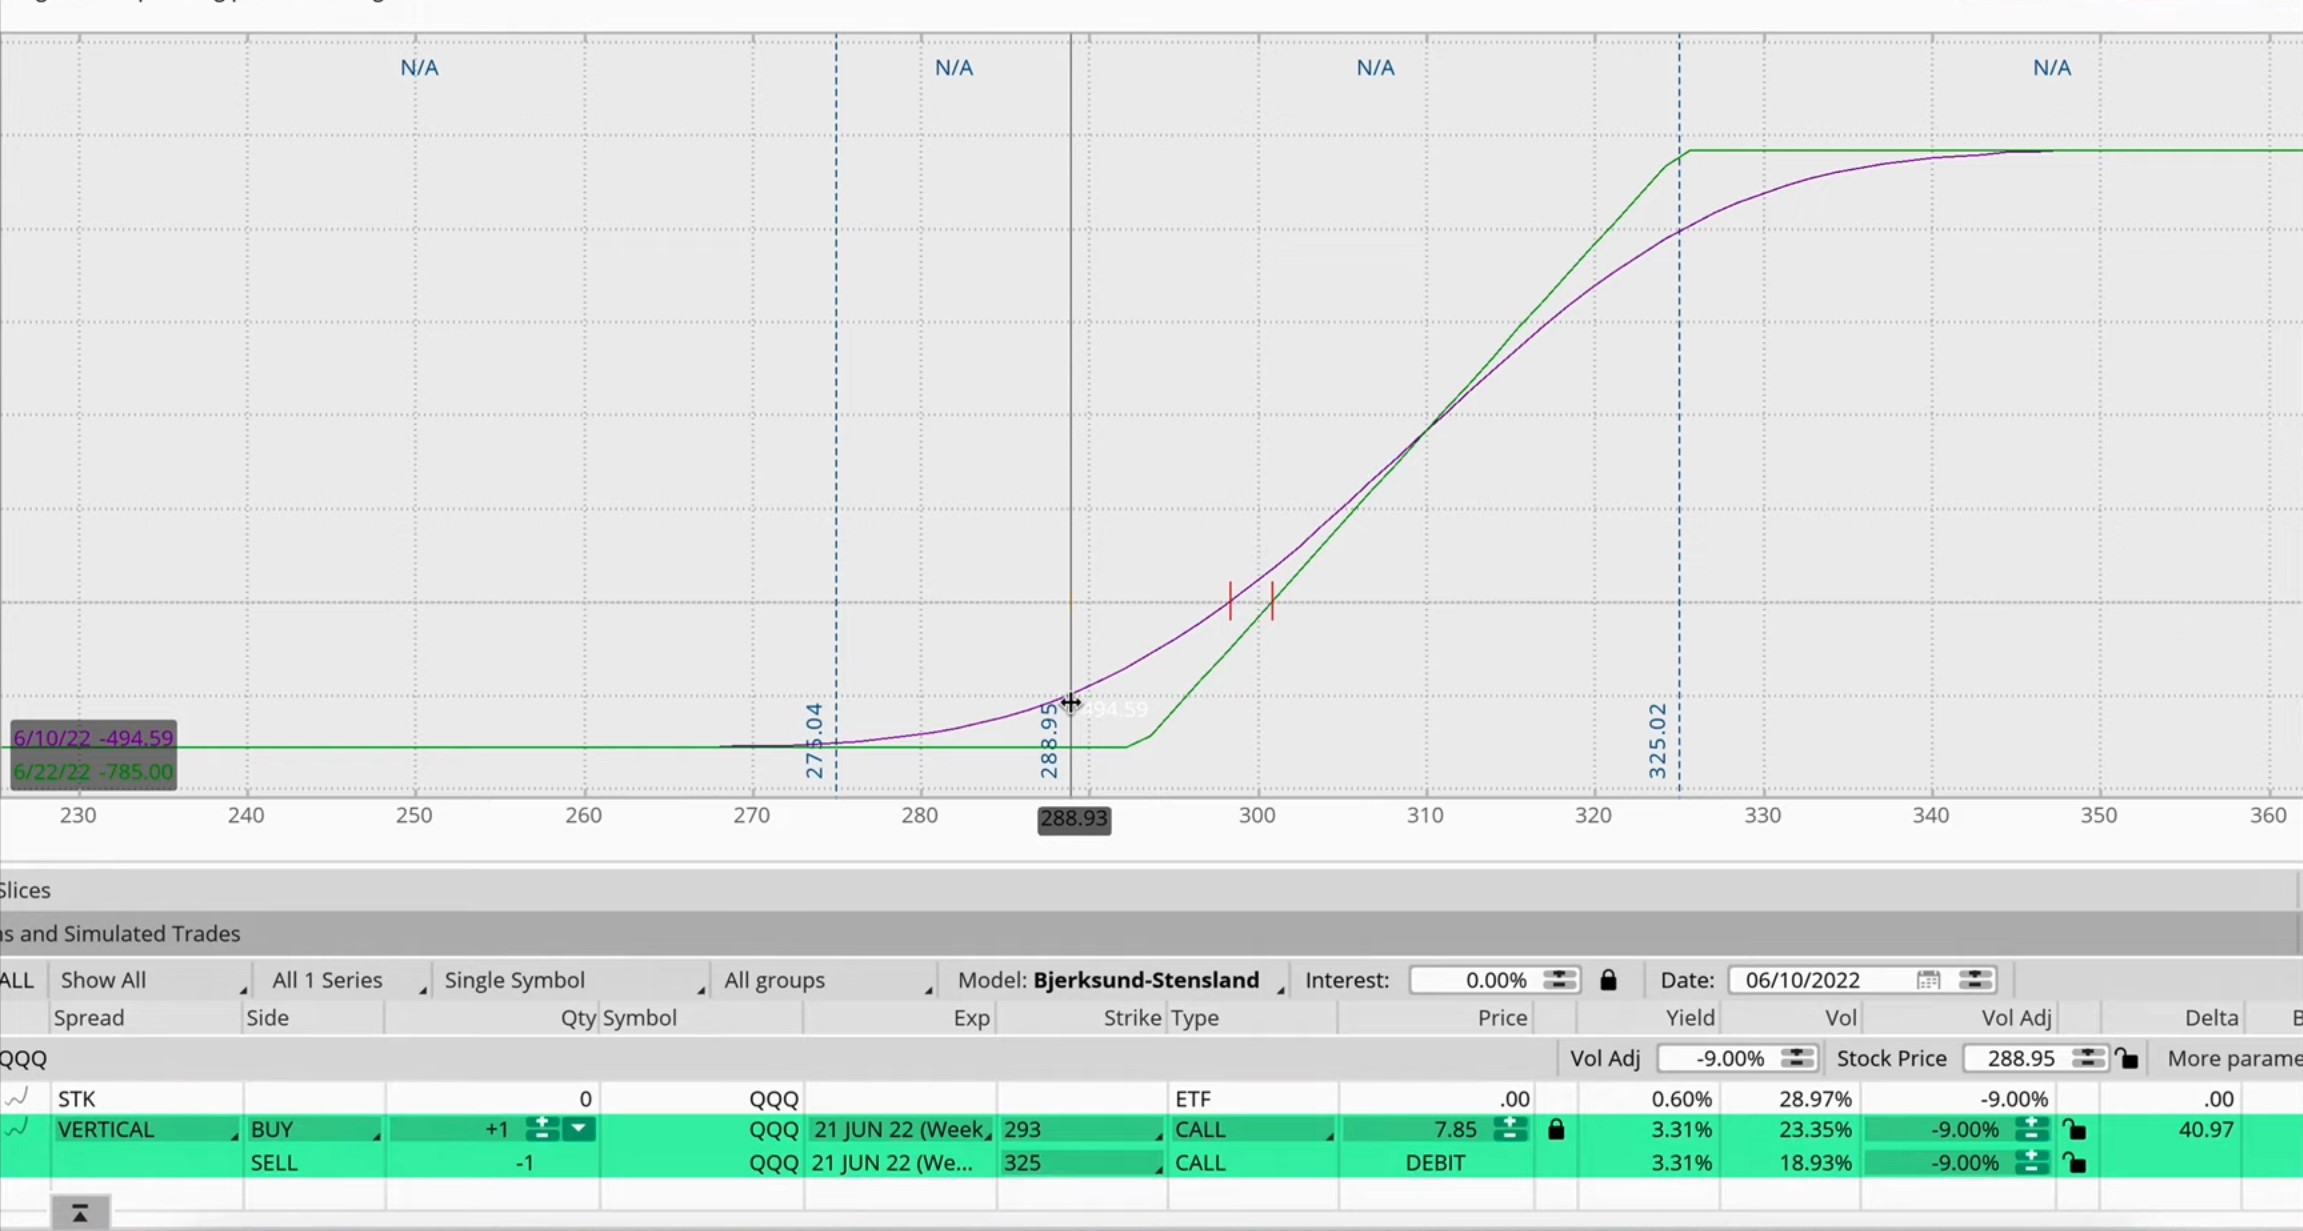
If I put my mouse at the starting price, the purple box says -494.59. So in other words in 20 days if the market doesn't move, I will get out. If I get out I'll lose about $495.
Now if the market drops to 275, I'm going to cut loss as I mentioned. So if I cut loss there, how much do I lose?
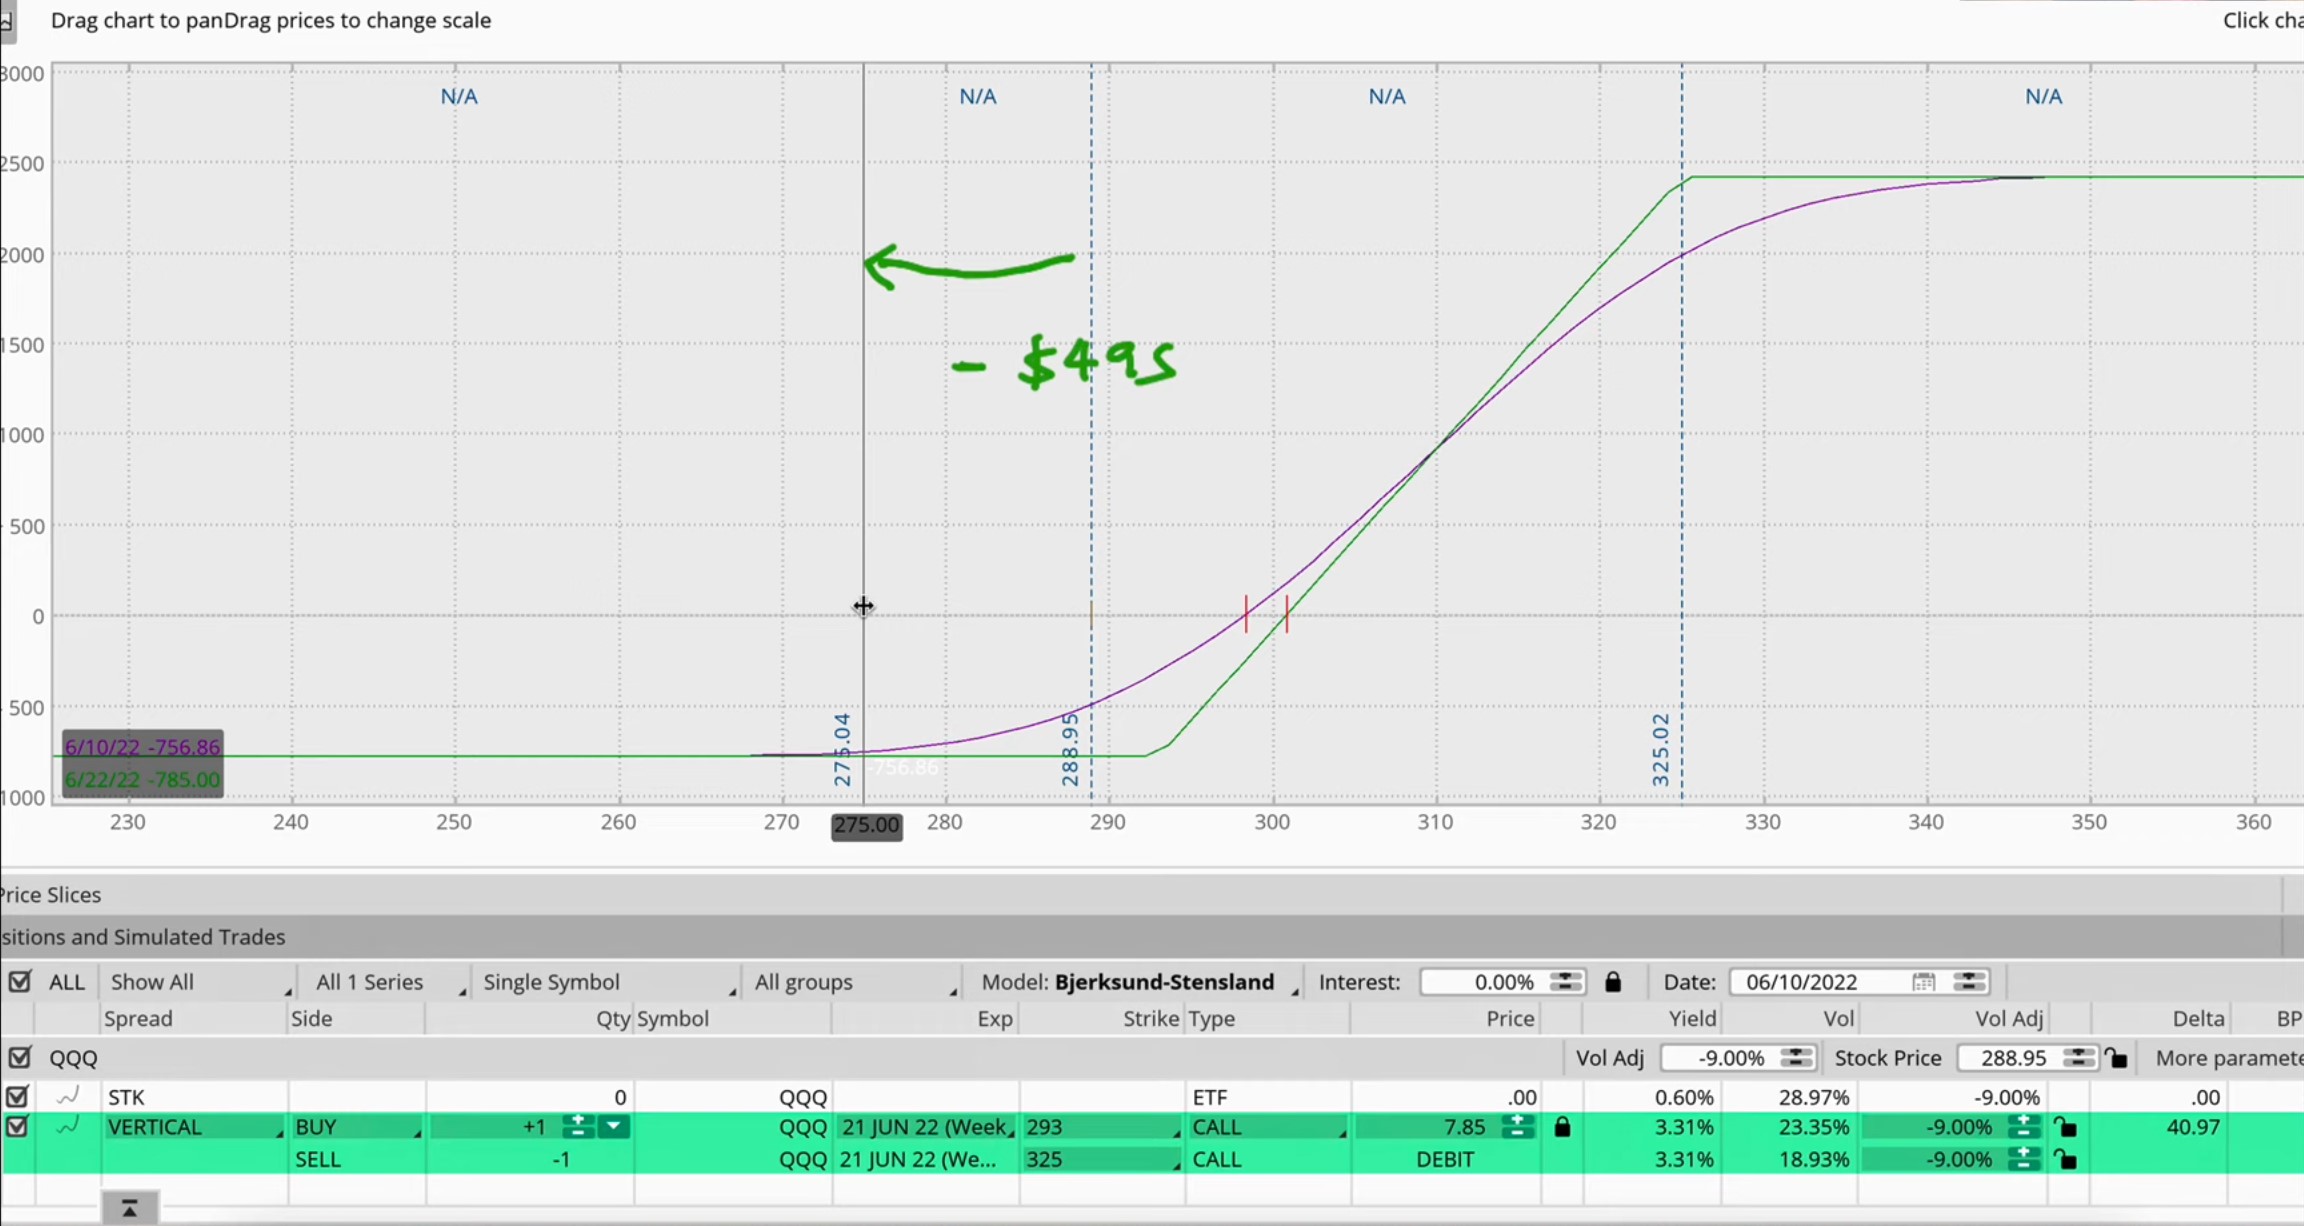
Look at the purple line — I'll lose about $757.
Now, what if the market goes to my target price?
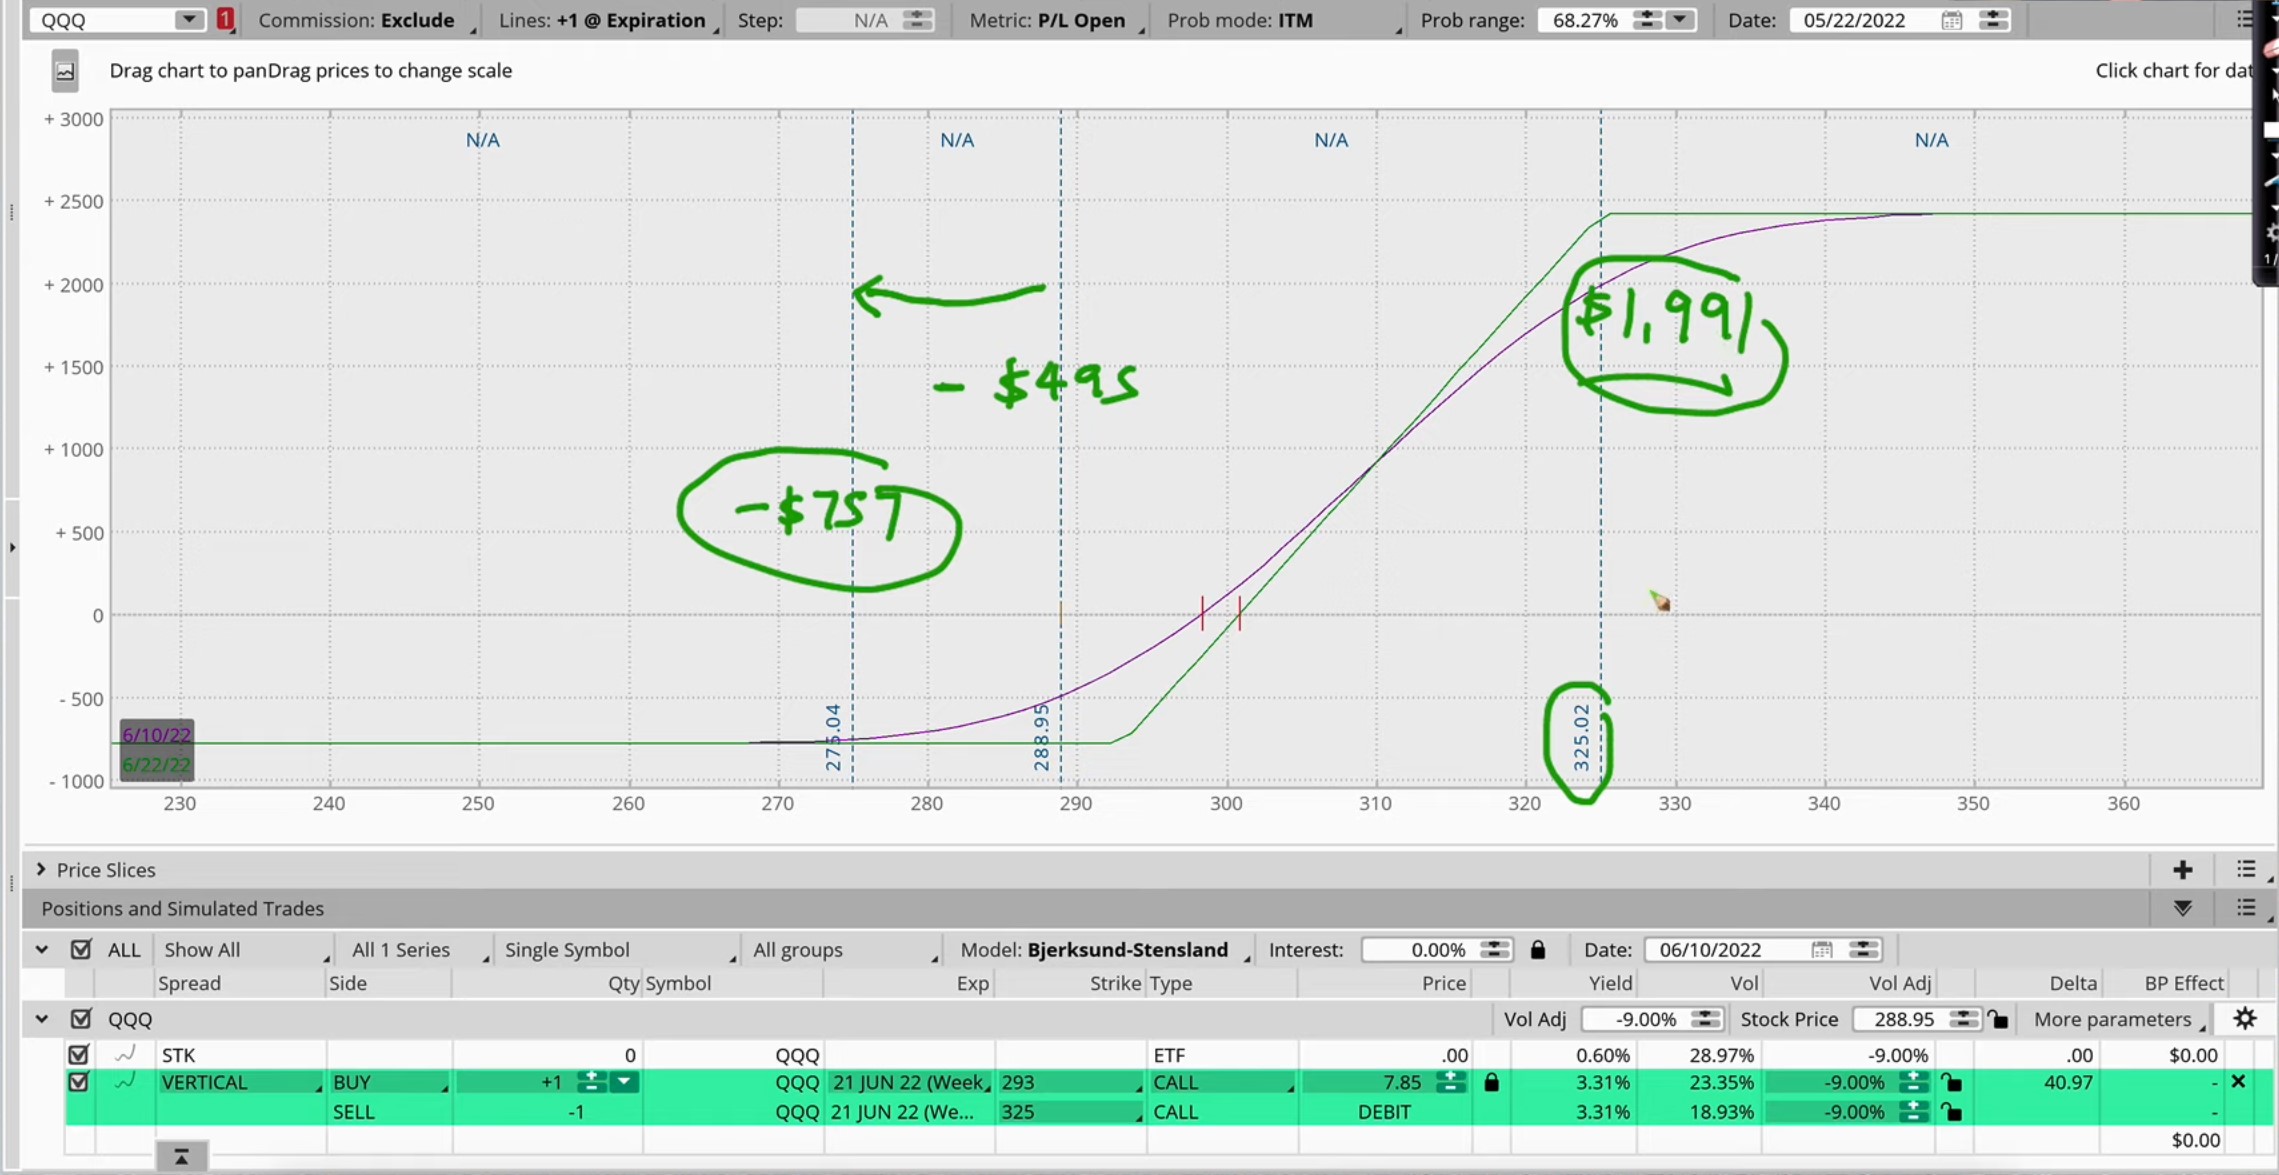
So if the market goes to 325, I will get $1991.
Of course, if it goes higher I will get the maximum of $2,415.
So if you take a look at this trade, if I take 1991 divided by 757, basically I'm risking 1 to make 2.6 of my risk. If it goes higher, I make 3X.
So is this a valid trade setup?
Yes. So again, in trading, as long as you risk 1 to make more than 1, it's a good trade and you don't have to be right all the time. You just have to be right more than you're wrong, and you'll be really profitable.
So are there even better strategies than this?
Yes, there are!
I'll create another video to show you how we use a BACK RATIO STRATEGY which is something that we teach in our Options classes.
Using the back ratio strategy, the cost of entering the trade is going to be a lot lower. The risk is going to be a lot lower at less than $200 and you can get a risk-reward ratio of 1:4 or even more!
I'll create another video to show you how to trade with even lower risk and higher reward using the back ratio strategy.
Until next time, may the markets be with you!
subscribe to our newsletter today!
Get first dibs on our latest investing & trading content every week FOR FREE!
*Your email address will not be forwarded to any third party. We respect your privacy.


submit your comment