Every investment decision starts with one quiet question: what could you earn without taking any real risk at all?
That number is widely known as the risk-free rate. It sits underneath every stock valuation, every bond price and every "is this worth it?" judgement you make as an investor.
If a stock, fund or property can't plausibly beat it, the extra risk isn't being paid for.
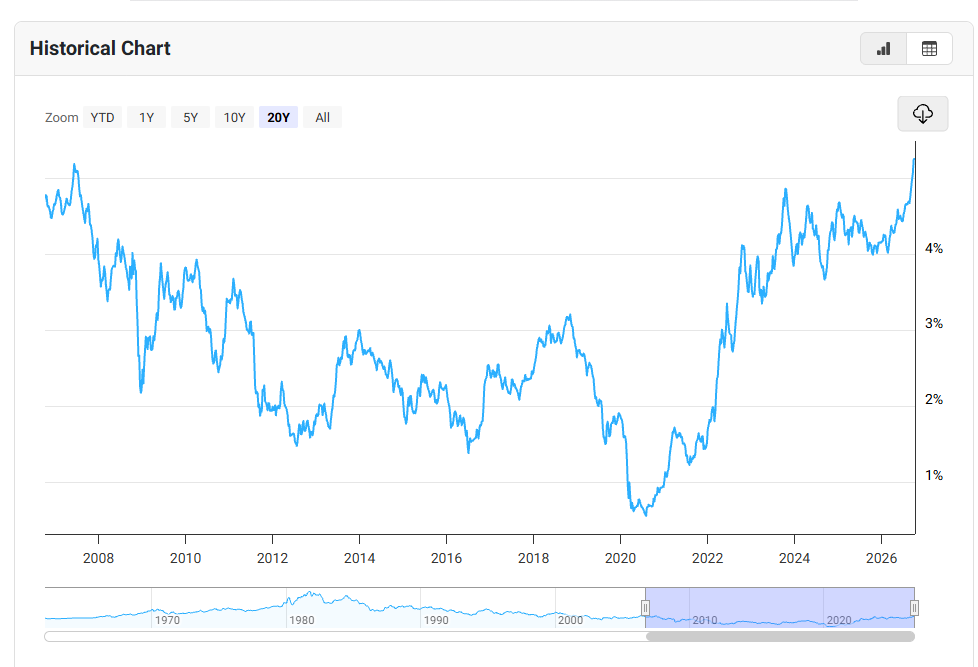
Before we go on any further, It’s worth being clear on one point: no investment is truly free of risk.
Every asset carries some level of uncertainty, whether that’s inflation, interest rate moves or currency swings.
A risk-free asset is better understood as the closest thing to certainty an investor can realistically get, rather than a guarantee.
In this guide, we'll show you how to find the risk-free rate, and we'll also look at how the risk-free rate shapes investors' appetite for risk, and why it sets the baseline return you should expect from riskier assets.
Quick answer: how to find the risk-free rate
- Pick your currency. Use a government bond issued in the same currency as the investment you're analyzing (US Treasuries for US stocks, Singapore Government Securities for SGD assets).
- Match the time horizon. Use a short-term bill (such as a 3-month T-bill) for short-term comparisons, and the 10-year government bond yield for long-term investments like stocks.
- Look up the current yield from an official source such as the US Treasury, FRED or the Monetary Authority of Singapore. That yield is your nominal risk-free rate. To get a slightly conservative risk-free rate, adjust it for expected inflation.
What Is the Risk-Free Rate?
The risk-free rate is the return you can earn on an investment with essentially zero risk of default. In practice, it is the yield on a government bond issued by a highly creditworthy government, in its own currency.
Why government bonds? A government that borrows in its own currency can, in the last resort, raise taxes or create money to repay that debt quite easily. That makes default unlikely, so investors treat the yield as the closest thing to a "guaranteed" return.
The risk-free rate compensates you for two things only:
- The time value of money. A dollar today is worth more than a dollar in ten years, because you give up the chance to use it now.
- Expected inflation. Lenders want to be paid back in money that still buys roughly what it did before.
Everything above that is a reward for taking the risk. That's why the risk-free rate is often called the baseline or hurdle rate for all other investments.
Common risk-free rate proxies by market
|
Market / currency |
Common proxy |
Typical use |
|
United States (USD) |
10-year Treasury note |
T-bill for short-term comparisons; 10-year for stock valuation |
|
Singapore (SGD) |
Singapore T-bills; 10-year Singapore Government Securities (SGS) bond |
SGD cash alternatives; valuing SGD-denominated assets |
|
Eurozone (EUR) |
10-year German Bund |
Euro-denominated valuations |
|
United Kingdom (GBP) |
10-year Gilt |
Sterling-denominated valuations |
|
Japan (JPY) |
10-year Japanese Government Bond (JGB) |
Yen-denominated valuations |
How to Find the Risk-Free Rate in 3 Steps
Finding the risk-free rate is mostly about choosing the bond, then reading its yield from a reliable source.
Here's the process.
Step 1: Match the currency of your investment
The risk-free rate must be in the same currency as the cash flows you're evaluating. If you're valuing Apple, whose earnings are in US dollars, use a US Treasury yield.
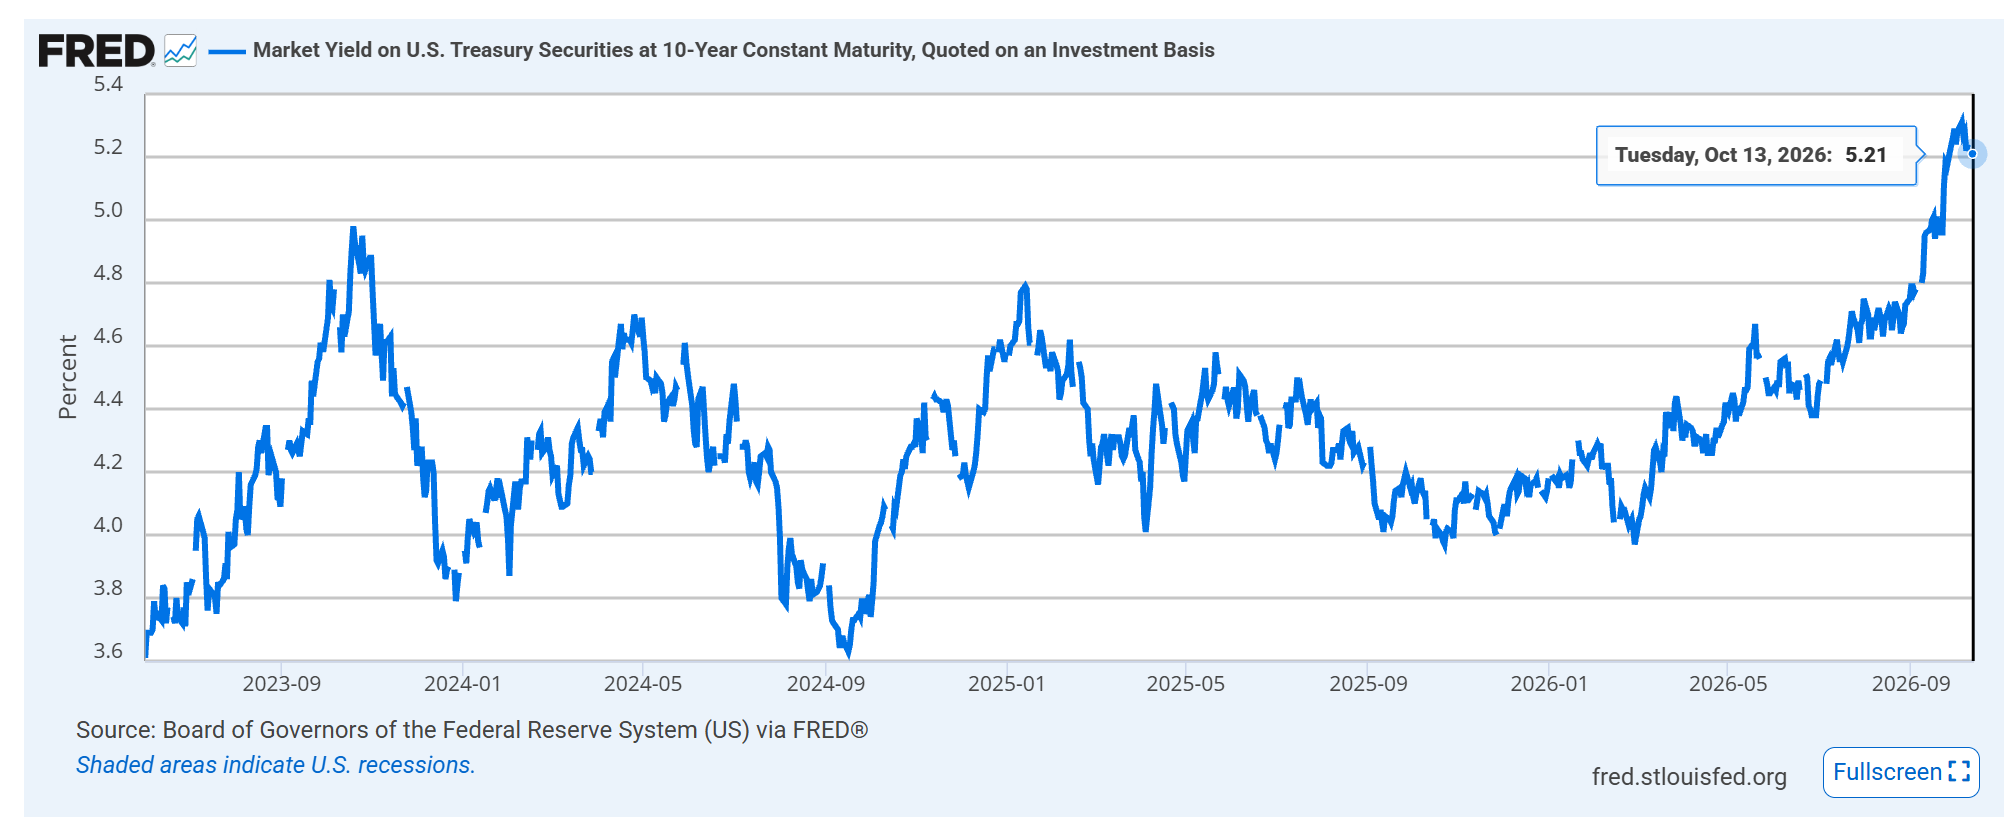
Source https://fred.stlouisfed.org/series/dgs10 (US 10 Year Yield)
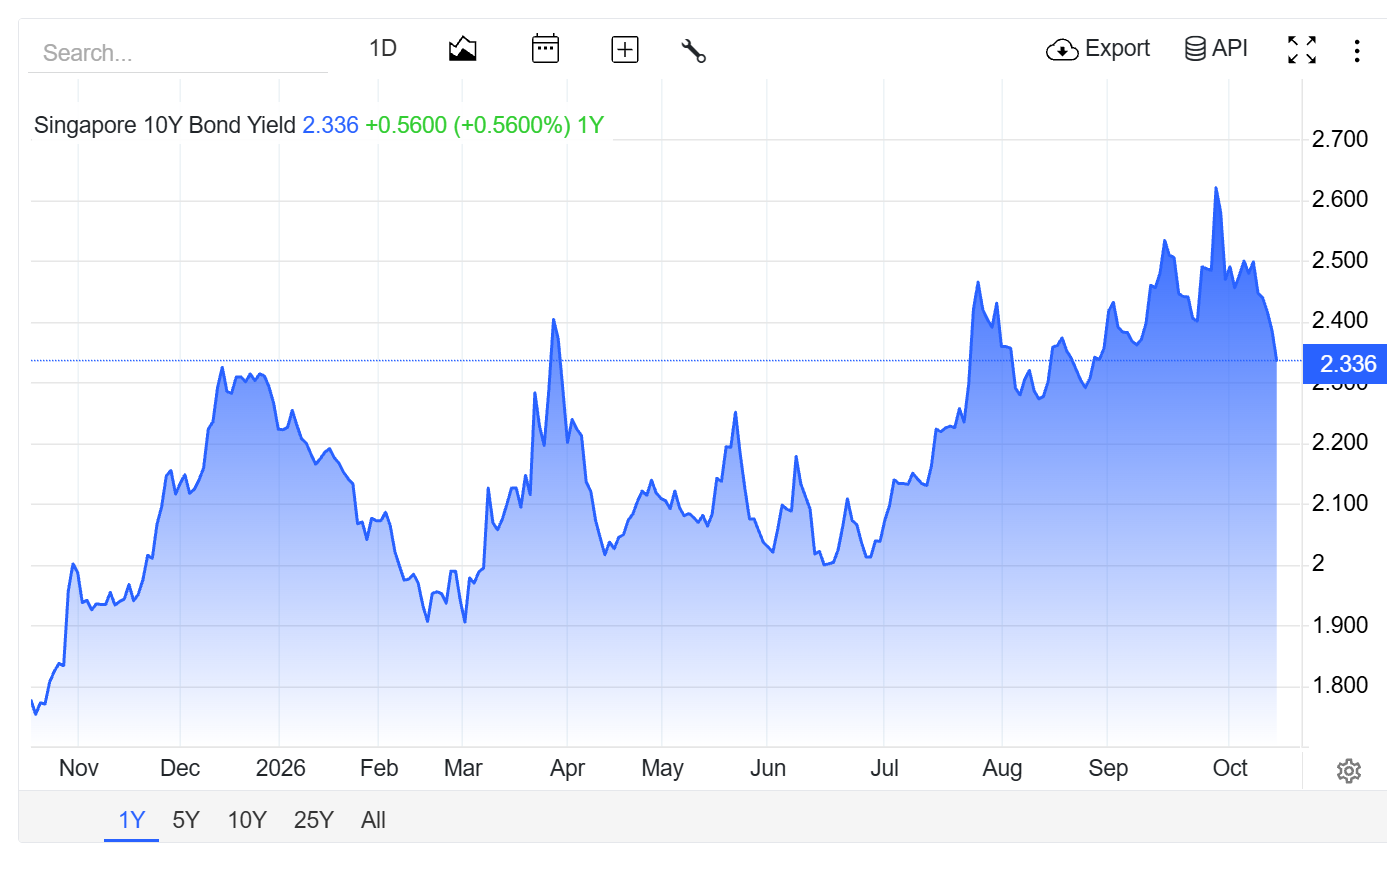
Source https://tradingeconomics.com/singapore/government-bond-yield (SG 10 year yield)
If you're comparing a Singapore REIT's SGD distributions, use a Singapore Government Securities yield.
Mixing currencies is one of the most common errors. A Singapore investor valuing a US stock should still use the US Treasury yield, because the company's cash flows are in USD. Currency risk is a separate decision, handled outside the valuation.

Step 2: Match the time horizon
Short-term decisions need a short-term rate; long-term decisions need a long-term rate.
Stocks are generally seen as long-duration assets, because most of their value comes from future cash flows many years out. That's why the 10-year government bond yield tends to be the standard risk-free rate for stock valuation.
Alternatively investors can also look into 5 year note yield and other shorter time horizon proxies.
Step 3: Look up the current yield from an official source
For US dollar assets:
- US Department of the Treasury publishes the Daily Treasury Par Yield Curve Rates, listing yields for maturities from 1 month to 30 years. Read the "10 Yr" column for the 10-year rate.
- FRED (Federal Reserve Bank of St. Louis) offers free historical charts. Search for series DGS10 (10-year Treasury) or DGS3MO (3-month Treasury).
For Singapore dollar assets:
- Monetary Authority of Singapore (MAS) publishes prices and yields for Singapore Government Securities, including SGS bonds and T-bills, along with auction results.
The yield you read is quoted as an annual percentage. If the 10-year column shows 4.25, your nominal risk-free rate is 4.25% per year. That's the number most valuation models use directly.
Tip: Avoid copying a yield from social posts or online articles. Yields change every trading day, so always go to the source and note the date you looked it up.
Which Risk-Free Rate Should You Use? T-Bill vs 10-Year Bond
The right maturity depends on how long your money will be tied up. Use the rule of thumb below to decide.
|
What you're doing |
Suggested proxy |
Why |
|
Comparing where to park cash for a few months |
3-month or 6-month T-bill |
Matches the short holding period |
|
Measuring a fund's risk-adjusted return (e.g. Sharpe ratio) over 1 year |
3-month or 1-year T-bill |
Matches the measurement period |
|
Valuing a stock with CAPM or a DCF model |
10-year government bond |
Stocks are long-duration assets |
|
Valuing a long-term project, property or infrastructure asset |
10-year or 20-30-year bond |
Match the life of the cash flows |
|
Pricing a short-dated option |
Treasury yield matching the option's expiry |
Matches the contract term |
Why not always use T-bills? Short-term rates move closely with central bank policy, so they can swing sharply within a single year.
The 10-year yield reflects the market's longer-term expectations for growth ,inflation and debt, which makes it a steadier anchor for long-term assets.
This is also why investors and generally the markets pay so much attention to the 10-year yield.
When it moves, the baseline for valuing almost every long-term asset naturally moves with it.
Where to get the inflation number
You have three common options:
- Market-implied real yield: In the US, Treasury Inflation-Protected Securities (TIPS) trade at a "real" yield. The 10-year TIPS yield is a ready-made market estimate of the real risk-free rate.
- Breakeven inflation: The 10-year Treasury yield minus the 10-year TIPS yield gives the market's implied inflation expectation.
- Official forecasts or central bank targets: For example, a central bank's stated inflation target or published forecast.
Whichever you choose, stay consistent. If your valuation's cash flows include inflation (as most company earnings forecasts do), use the nominal rate. Use the real rate only with cash flows stated in today's money.
How the Risk-Free Rate Sets the Baseline for Riskier Assets
The risk-free rate is the floor every investment has to clear, to make sense. Any asset that carries more risk than a government bond should be expected to offer a higher expected return, or rational investors have no reason to hold it.
That extra return is called the risk premium:
Think of it as a ladder. The risk-free rate is the bottom rung, and each step up in risk needs a bigger premium on top.
|
Asset type |
Main extra risks |
What investors demand |
|
|
Government T-bills and bonds |
Inflation, interest rate risk |
The risk-free rate itself |
|
|
Investment-grade corporate bonds |
Some default risk |
Risk-free rate + a small credit spread |
|
|
High-yield (junk) bonds |
Higher default risk |
Risk-free rate + a larger credit spread |
|
|
Dividend stocks and REITs |
Price swings, business risk |
Risk-free rate + an equity risk premium |
|
|
Broad stock market index |
Market-wide downturns |
Risk-free rate + the equity risk premium |
|
|
Small caps, emerging markets, early-stage growth stocks |
Volatility, liquidity, business failure |
Risk-free rate + a larger premium |
Why does Risk Free Rate matters for Investor’s expectations
The ladder gives you a reality check before you invest. Here's a simple illustration (illustrative numbers only):
- If the 10-year yield is 4.5%, a government bond pays roughly 4.5% with very little risk.
- A dividend stock yielding 4% is now competing against that 4.5%. And unlike the bond, that 4% comes with risk: the share price can rise or fall, so your total return may end up well above or below what you projected. Dividends can also be cut if the business struggles.
- For the stock to make sense, its total expected return (dividends plus growth) needs to clear 4.5% plus a premium that compensates for the risk of loss.
If an investment's realistic expected return barely beats the risk-free rate, you're taking on risk without being paid for it. That single comparison filters out a lot of poor opportunities.
Note that a risk premium is an expectation, not a promise. Riskier assets are expected to earn more over long periods, but in any given year they can and do underperform government bonds, sometimes sharply.
How the Risk-Free Rate Shapes Investors' Risk Appetite
The risk-free rate doesn't just set a hurdle. It changes how much risk investors are willing to take in the first place, and which investment vehicles they reach for.
The reason is opportunity cost. Every dollar in a stock, fund or property is a dollar that could be sitting in a government bond earning the risk-free rate. When that safe return changes, the trade-off behind every other choice changes with it.
When the risk-free rate is low
When government bonds pay close to nothing, safe assets stop doing their job of growing wealth. Investors who need returns (for retirement, income or to beat inflation) are pushed further up the risk ladder.
This became known as TINA: "There Is No Alternative" to stocks. Typical patterns in low-rate periods include:
- Money flowing out of cash and bonds into equities, REITs and high-yield bonds in search of income
- Investors accepting higher valuations, because future cash flows are discounted at a lower rate
- Growing appetite for speculative assets and long-duration growth stocks, whose value sits far in the future
- Possible more use of leverage, since borrowing is cheap
When the risk-free rate is high
When government bonds and T-bills pay a meaningful return, investors now have a real alternative. The bar for taking risk rises.
Some have called this shift TARA: "There Are Reasonable Alternatives." Typical patterns include:
- Cash flowing into T-bills, fixed deposits, money market funds and short-term bonds
- Investors demanding lower valuations (higher earnings yields) before buying stocks
- Pressure on long-duration growth stocks and rate-sensitive sectors such as REITs and utilities
- Less tolerance for unprofitable or highly speculative companies
Rate environment and investor behaviour at a glance
|
Low risk-free rate |
High risk-free rate |
|
|
Appeal of cash and bonds |
Weak; returns may not beat inflation |
Strong; a real return with little risk |
|
Appetite for stocks |
High; few alternatives |
More selective; higher hurdle |
|
Valuations investors accept |
Higher |
Lower |
|
Growth vs value |
Long-duration growth favoured |
Profitable, cash-generating businesses favoured |
|
Speculative assets |
Often in demand |
Often under pressure |
What this means for you as an investor
The risk-free rate doesn't tell you what to buy. It tells you what you're being paid to give up. A useful habit is to ask, for any investment: "How much more than the government bond yield do I realistically expect, and is that enough for the risk I'm taking?"
Your own time horizon, goals and tolerance for losses still matter most. Two investors facing the same risk-free rate can reasonably make very different choices.
Is the Risk-Free Rate Really Risk-Free?
Not entirely. "Risk-free" means free of meaningful default risk, not free of all risk.
Even government bonds expose you to:
- Inflation risk: if inflation runs higher than expected, your real return can turn negative.
- Interest rate risk: if you sell a bond before maturity after rates rise, its price will have fallen.
- Reinvestment risk: when a short-term bill matures, you may only be able to reinvest at a lower rate.
- Sovereign credit risk: low, but not zero. The US government's credit rating has been cut below the top AAA grade by major rating agencies over the past decade and a half.
- Currency risk: for a Singapore investor holding US Treasuries, USD/SGD moves affect returns in SGD terms
Why it is important to understand currency risks
*The risk tends to be more complex when the money used to invest is borrowed in another currency.
The yen carry trade is a clear example: for years, investors borrowed Japanese yen at near-zero rates to buy higher-yielding assets such as US bonds and stocks. When the Bank of Japan raised rates, those loans became more expensive, forcing selling. The unwind contributed to a sharp global market sell-off in early August 2024, including Japan’s Nikkei suffering one of its worst single-day falls on record.
Frequently Asked Questions
Is the risk-free rate the 10-year Treasury yield?
For valuing US stocks and other long-term USD assets, the 10-year Treasury yield is the most common proxy. For short-term comparisons, the 3-month T-bill is more appropriate.
How do you determine the risk-free rate for a DCF?
Use the yield on a government bond in the same currency as the cash flows, with a maturity close to the forecast horizon. For most stock DCFs, that's the 10-year government bond yield.
Why does the risk-free rate change?
It moves with central bank policy, inflation expectations, economic growth expectations and demand for government bonds. Short-term rates track central bank decisions most closely; the 10-year yield reflects longer-term expectations.
Is a higher risk-free rate good or bad for investors?
It cuts both ways. Savers and bond buyers earn more on safe assets, but higher rates raise the discount rate used to value stocks, which tends to put pressure on valuations, especially for long-duration growth stocks.
What is the difference between the risk-free rate and the risk premium?
The risk-free rate is the return on a near-riskless government bond. The risk premium is the extra return investors expect for holding a riskier asset. Together, they make up the required return.










submit your comment