How are you feeling about the stock markets recently? If you're like most people, you're probably feeling really lousy about the markets, and your portfolio is probably down the last couple of months. . .
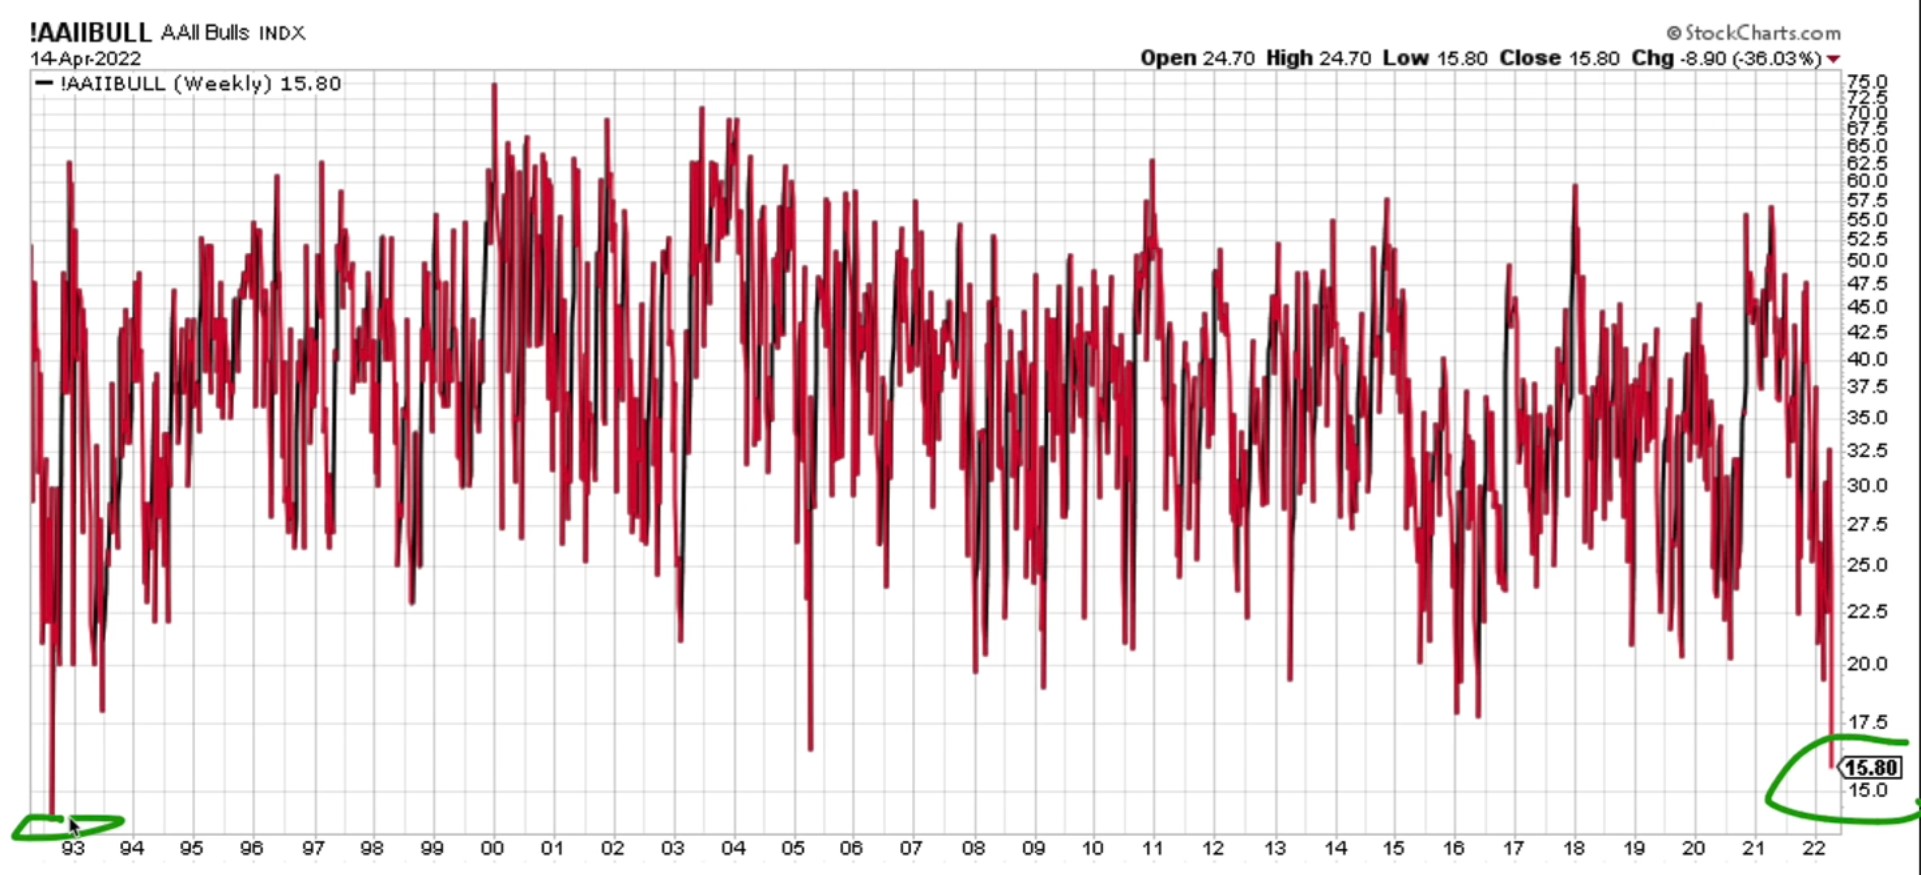
You're not alone. In fact, a survey of individual investors in America found that the current level of bullishness is extremely low. In fact, right now only 15.8% of retail investors are bullish and 48% are bearish. The level of bullishness has not been so low, and bearishness so high, since 1992, which was 30 years ago.
So why are people so bearish right now?
Table Of Contents
Latest Chart Analyses: Exciting Or Scary?
Is Your Portfolio Down So Far This Year?
'Why I'm Feeling EXCITED Right Now
So What's Causing The Market Sell-Off?
Well, who can blame them for being so bearish? We've got a confluence of a lot of things:
- Sky-high inflation is now above 8%
- A Federal Reserve that needs to bring inflation down
- The war in Ukraine excavating this high inflation due to rising energy & commodity costs
So the Federal Reserve is going to raise interest rates more aggressively and quantitative tightening which is going to suck up liquidity out of the market. This is causing a lot of stocks to go down in the last 3 to 4 months, especially companies in the technology & consumer discretionary sector.
Latest Chart Analyses: Exciting Or Scary?
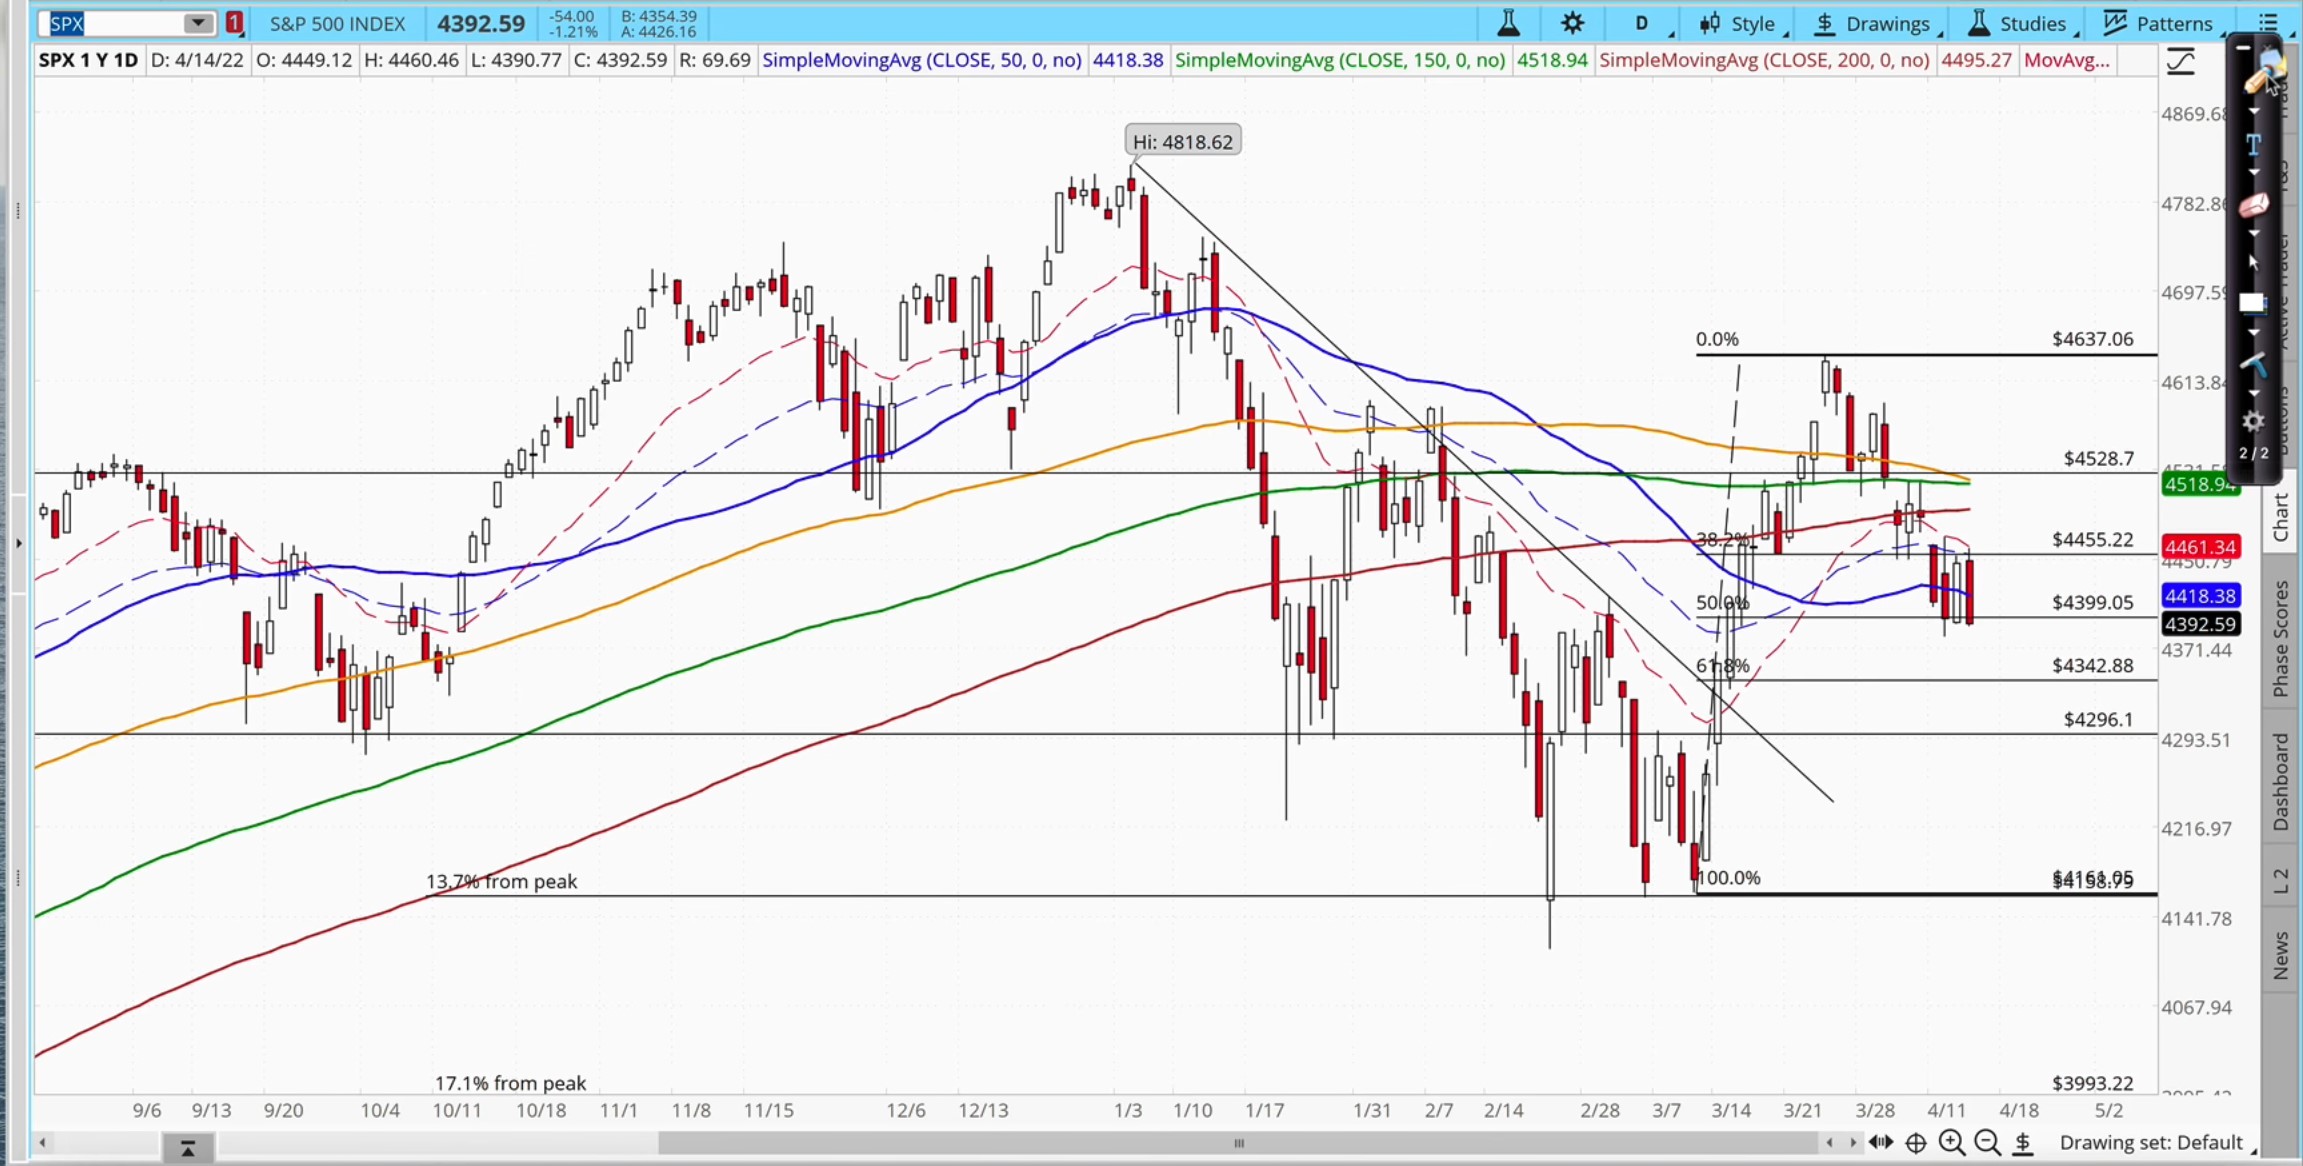
The market can't seem to sustain much bullish momentum as well. From the start of the year, we had that very strong downtrend, and then we broke above that downtrend resistance in mid of March. We had a very strong rally going up but then we started retracing all the way back down.
Right now we are actually at the 50 moving average on the S&P 500 and right at the 50% Fibonacci level.
What was interesting was that a few days ago, the market actually closed with a bullish engulfing candle that hinted at an imminent rally. However, after this bullish engulfing pattern, we had abearish engulfing pattern, which overrides that bullish engulfing pattern.
For now, with this bearish engulfing pattern, we could see some more bearishness in the short term. We could go back down and retest the lows in March. So that's the S&P 500, which is down about 8% so far this year.
So how about the NASDAQ?
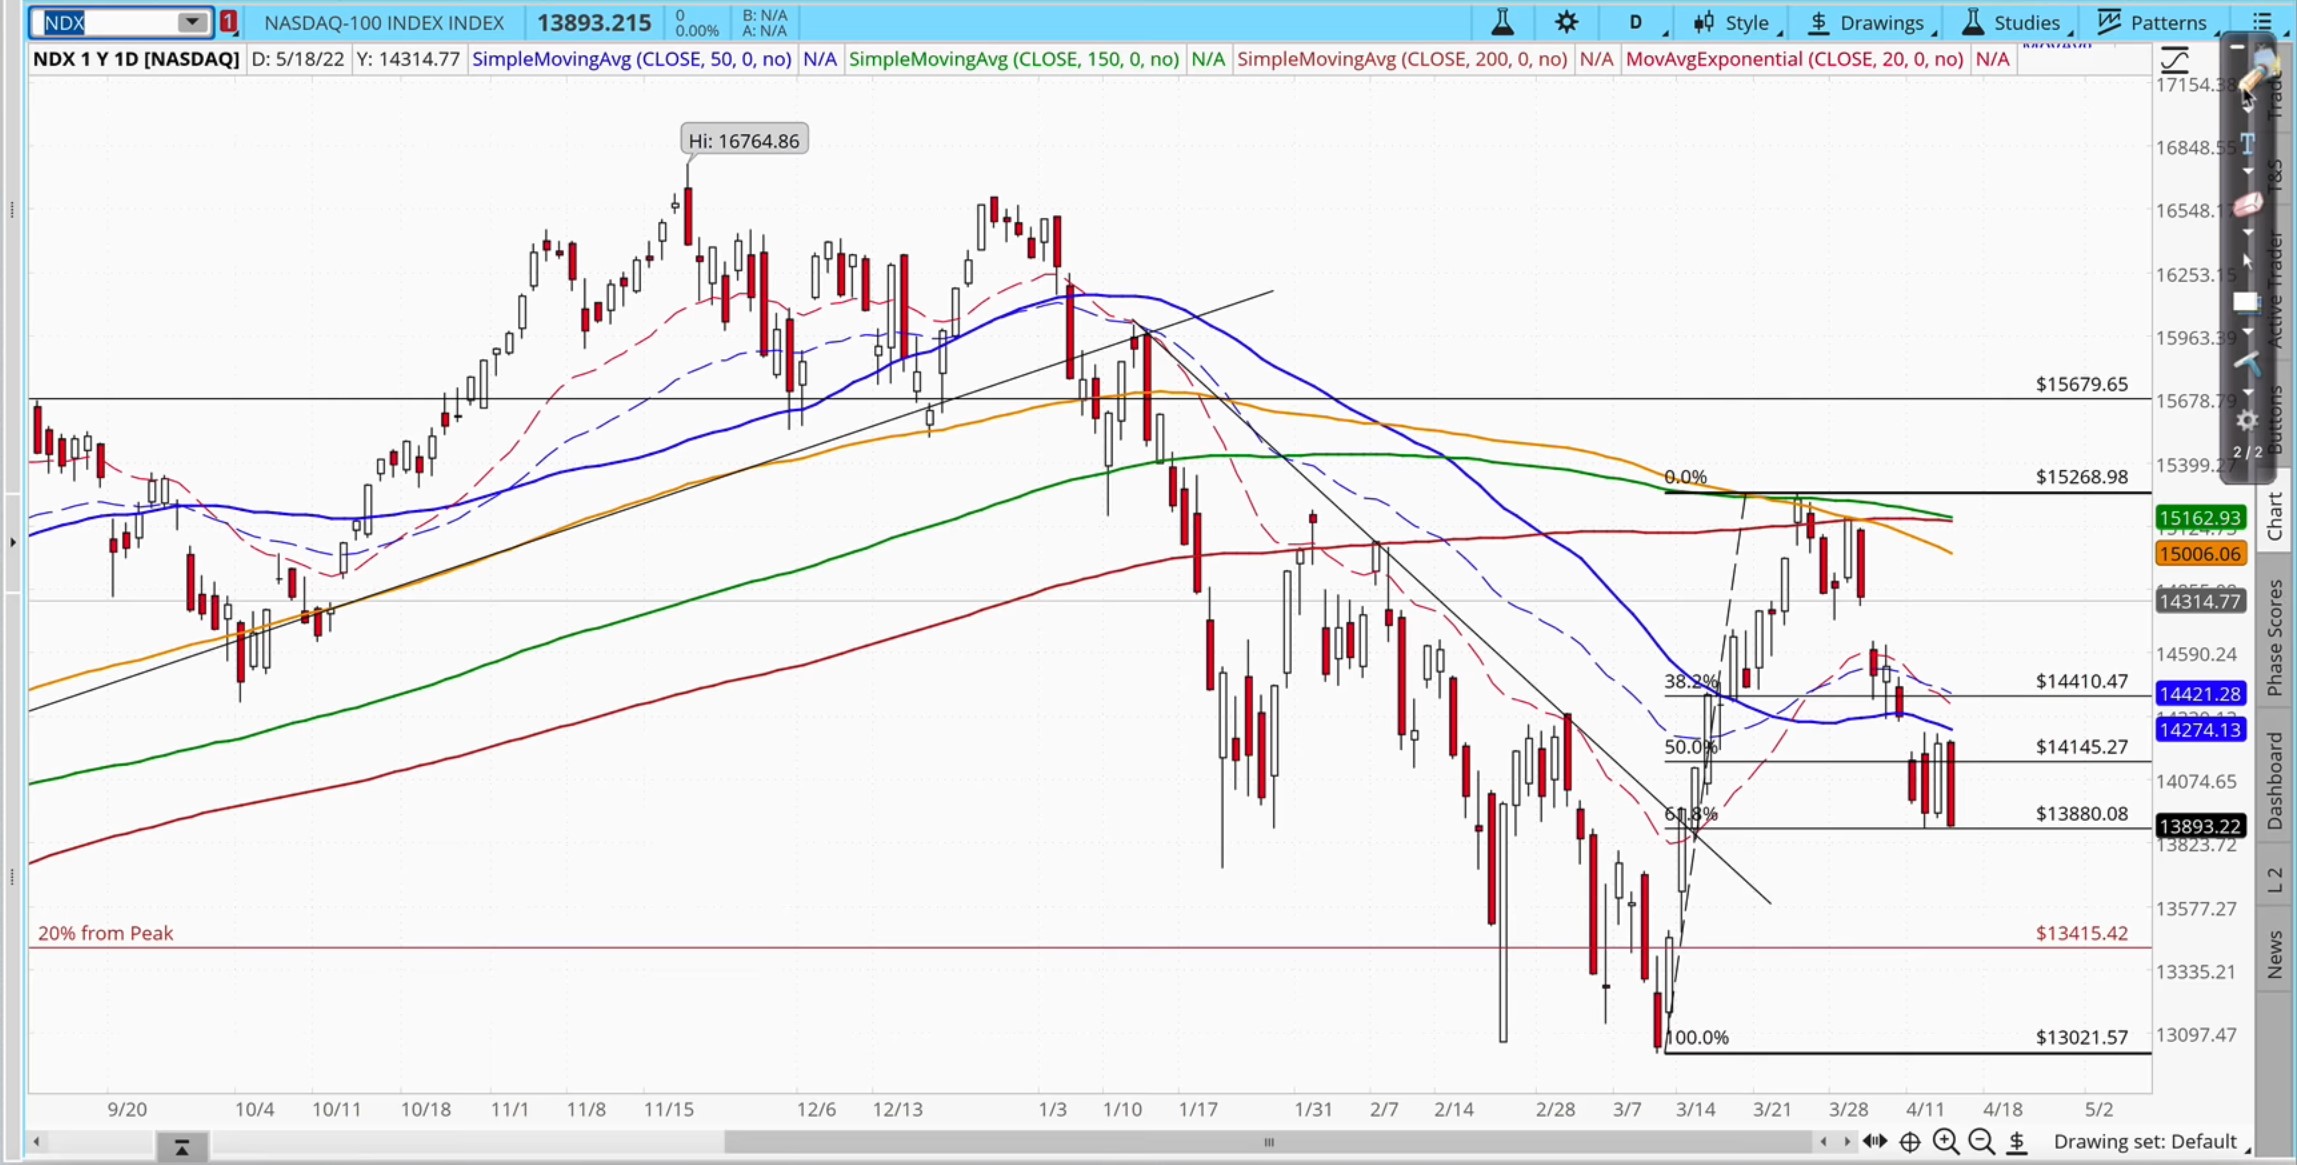
The NASDAQ is even more bearish but it has a very similar pattern to the S&P 500.
We had that initial downtrend earlier on, followed by that strong reversal upwards, and then we had it touching the 200 moving average and reversing back down to the 61.8% Fibonacci level. It closed on the bearish engulfing pattern, so right now if you ask me, I'm 50-50 in the short term. It may bounce back from here but it could still go back down, especially after that bearish engulfing candle.
Everything looks bearish right now, we've got bearish news, bearish markets, but I'm actually pretty excited about what's going on right now and I'm actually very very bullish on the medium to longer term.
Is Your Portfolio Down So Far This Year?
First and foremost, if your portfolio is down for the last couple of months you are not alone. It doesn't mean you are a lousy investor, it doesn't mean that you made a mistake, because no matter how good of an investor you are, your portfolio can't go up every day, every week, every month, or every quarter.
There will be ups and downs. It's just part of the game of trading & investing. Let me show you my portfolio — but to be fair to my paying subscribers that subscribe to my UIP™ (The Ultimate Investors Playbook™), I won't show all my positions here, the subscribers get to see my entire portfolio line by line and see my portfolio review every single month so.
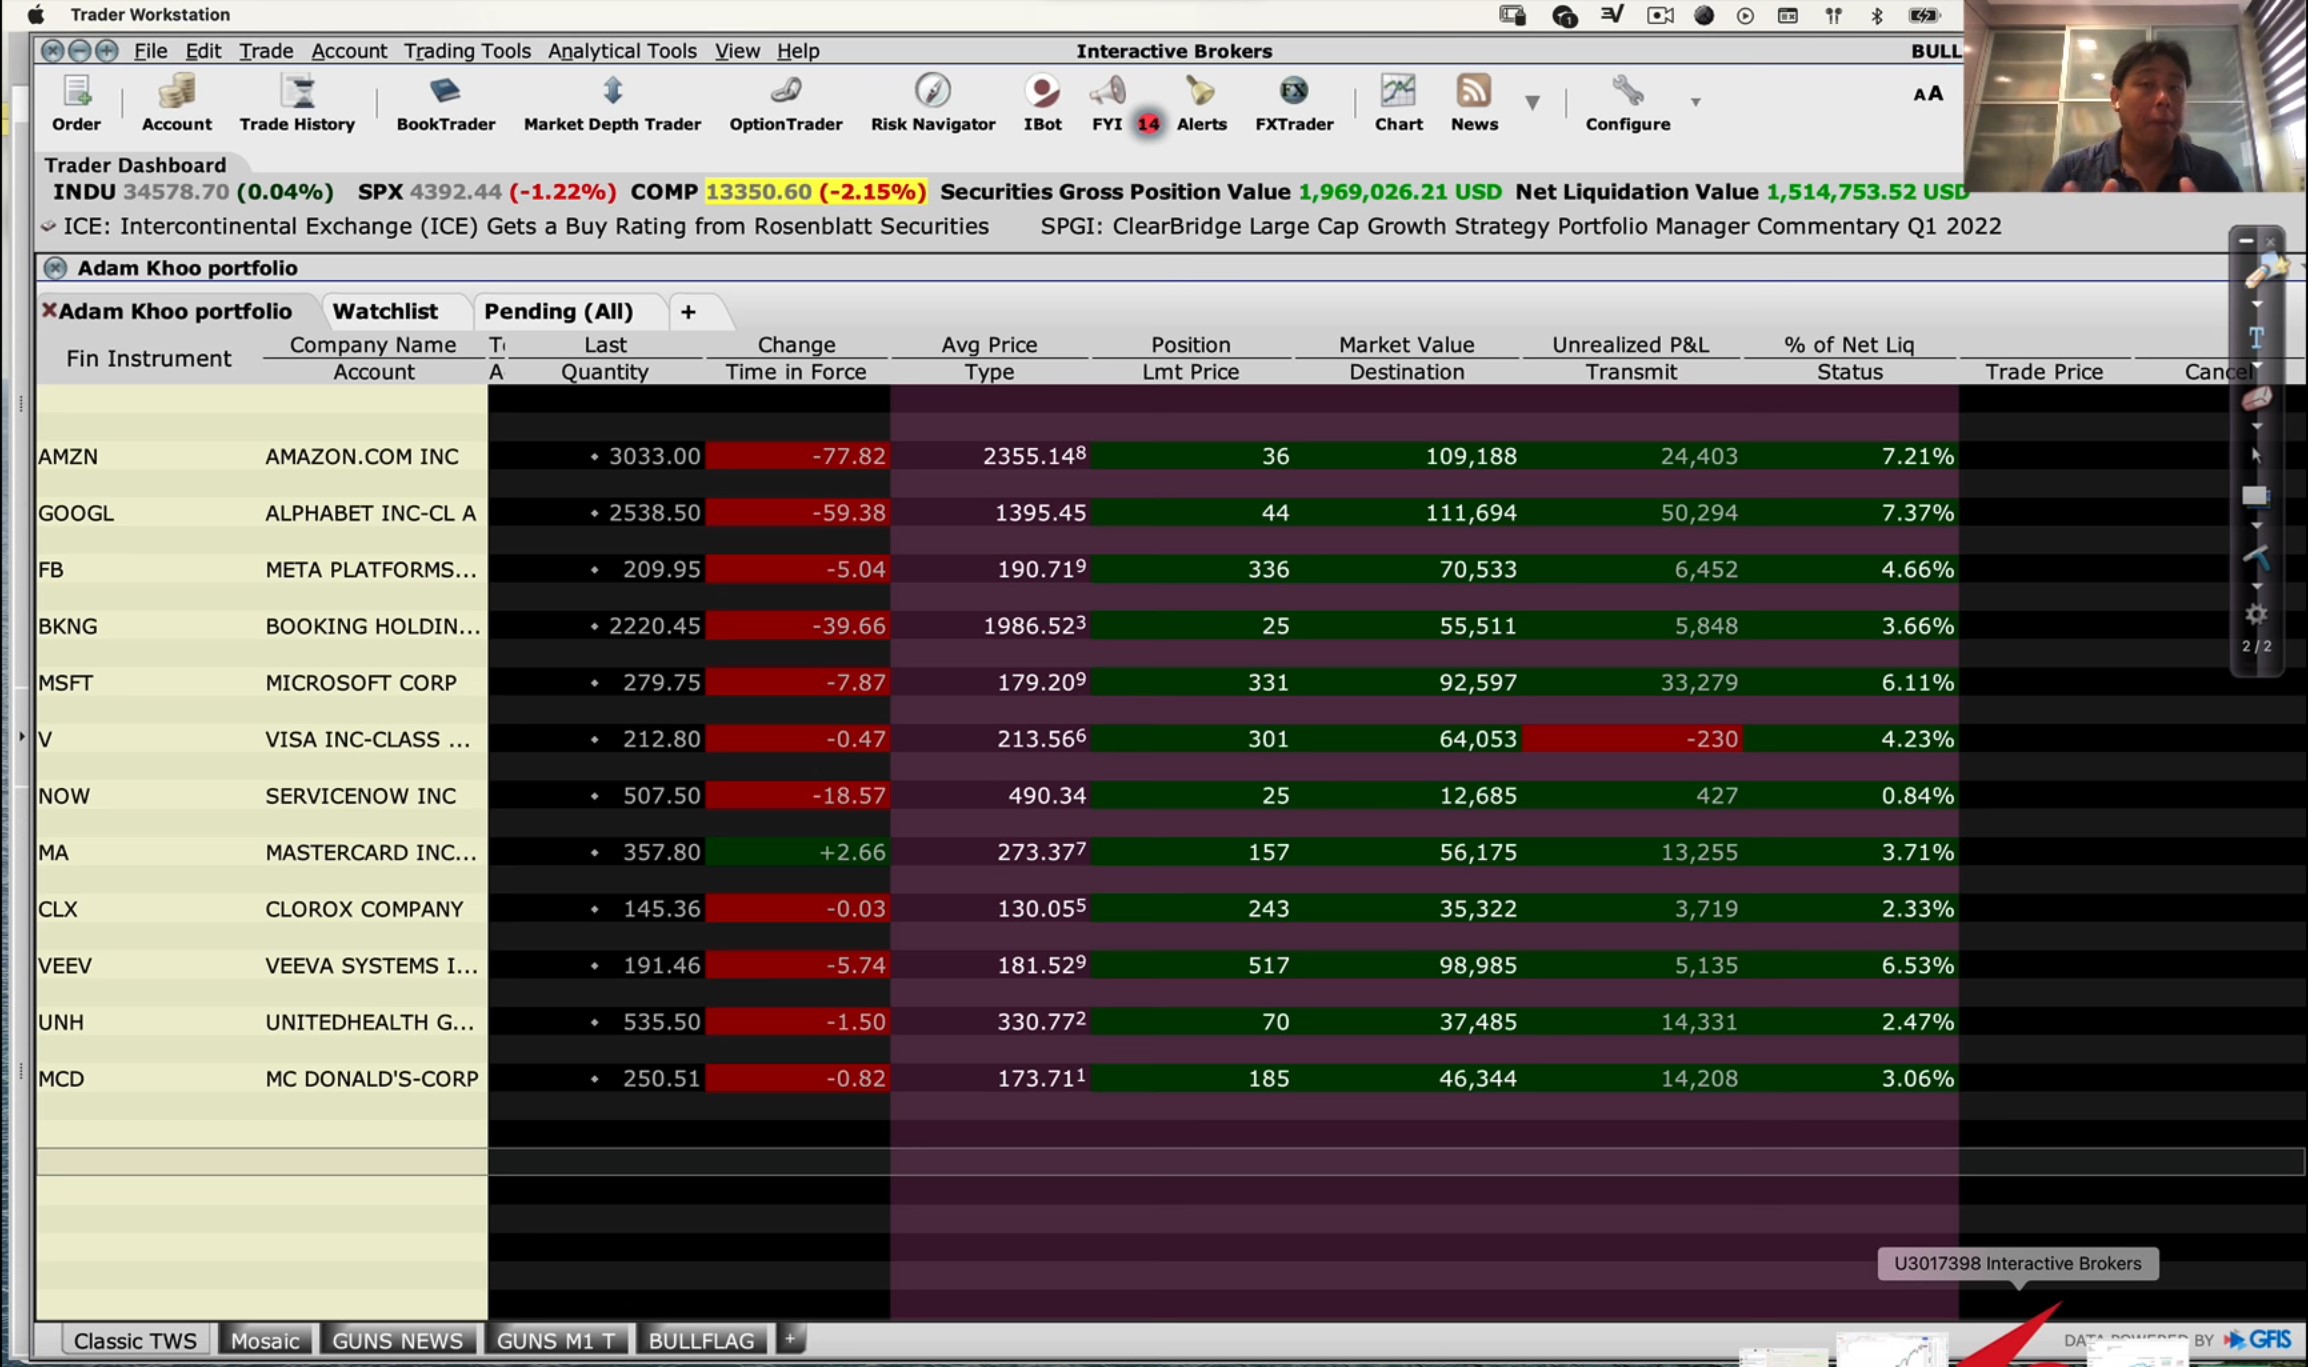
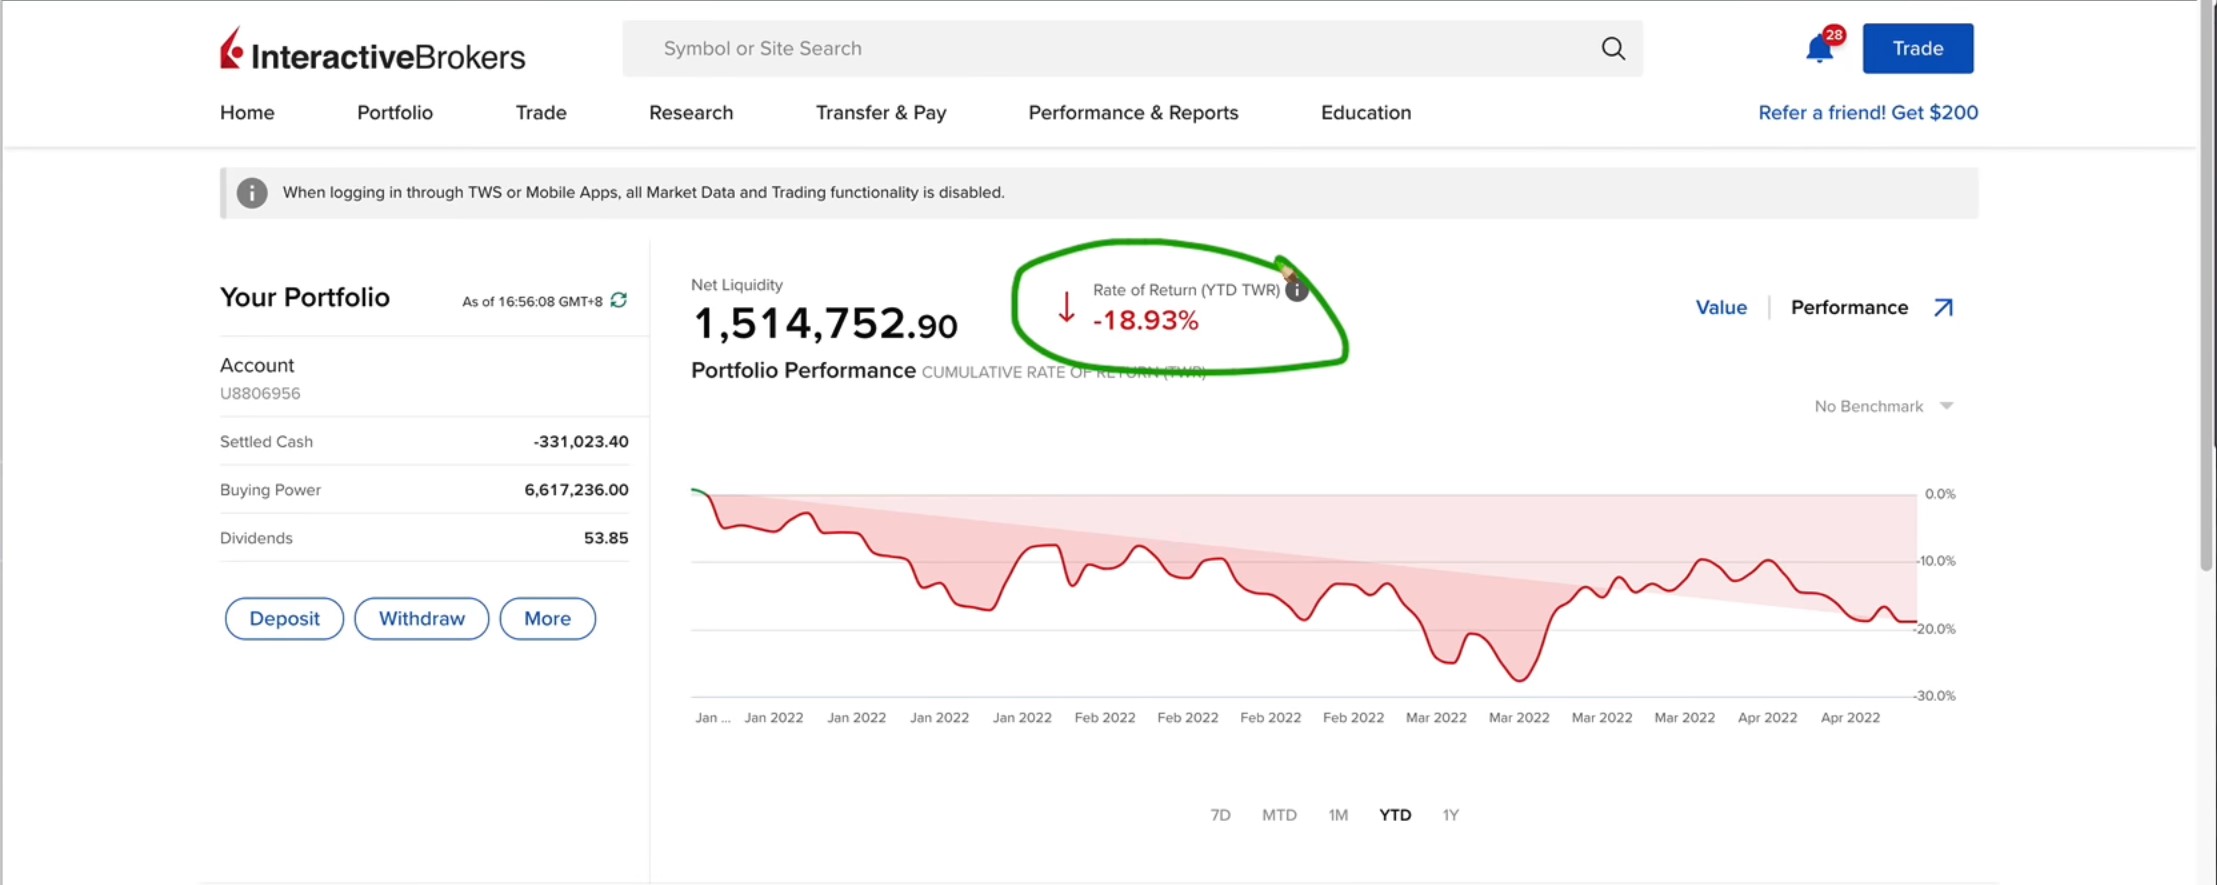
This here above is one of my portfolios, and year-to-date I'm down about 18.9%.
Am I concerned? Am I upset?
Of course not, I have no worries because this is not my first rodeo. I've been in the markets for so many years and every time my portfolio is down, it goes back even higher eventually.
Now the S&P 500 is down 8% so far this year, and my portfolio is down almost 19% so far this year. I'm kind of underperforming the S&P 500 in the short term. Again I have no worries because historically, every time my portfolio dropped and underperformed the S&P 500 in the short term, it outperformed even more in the long run.
So let me show you my performance report over a longer period because in the short term anything can happen, but it's in the longer term that's important.
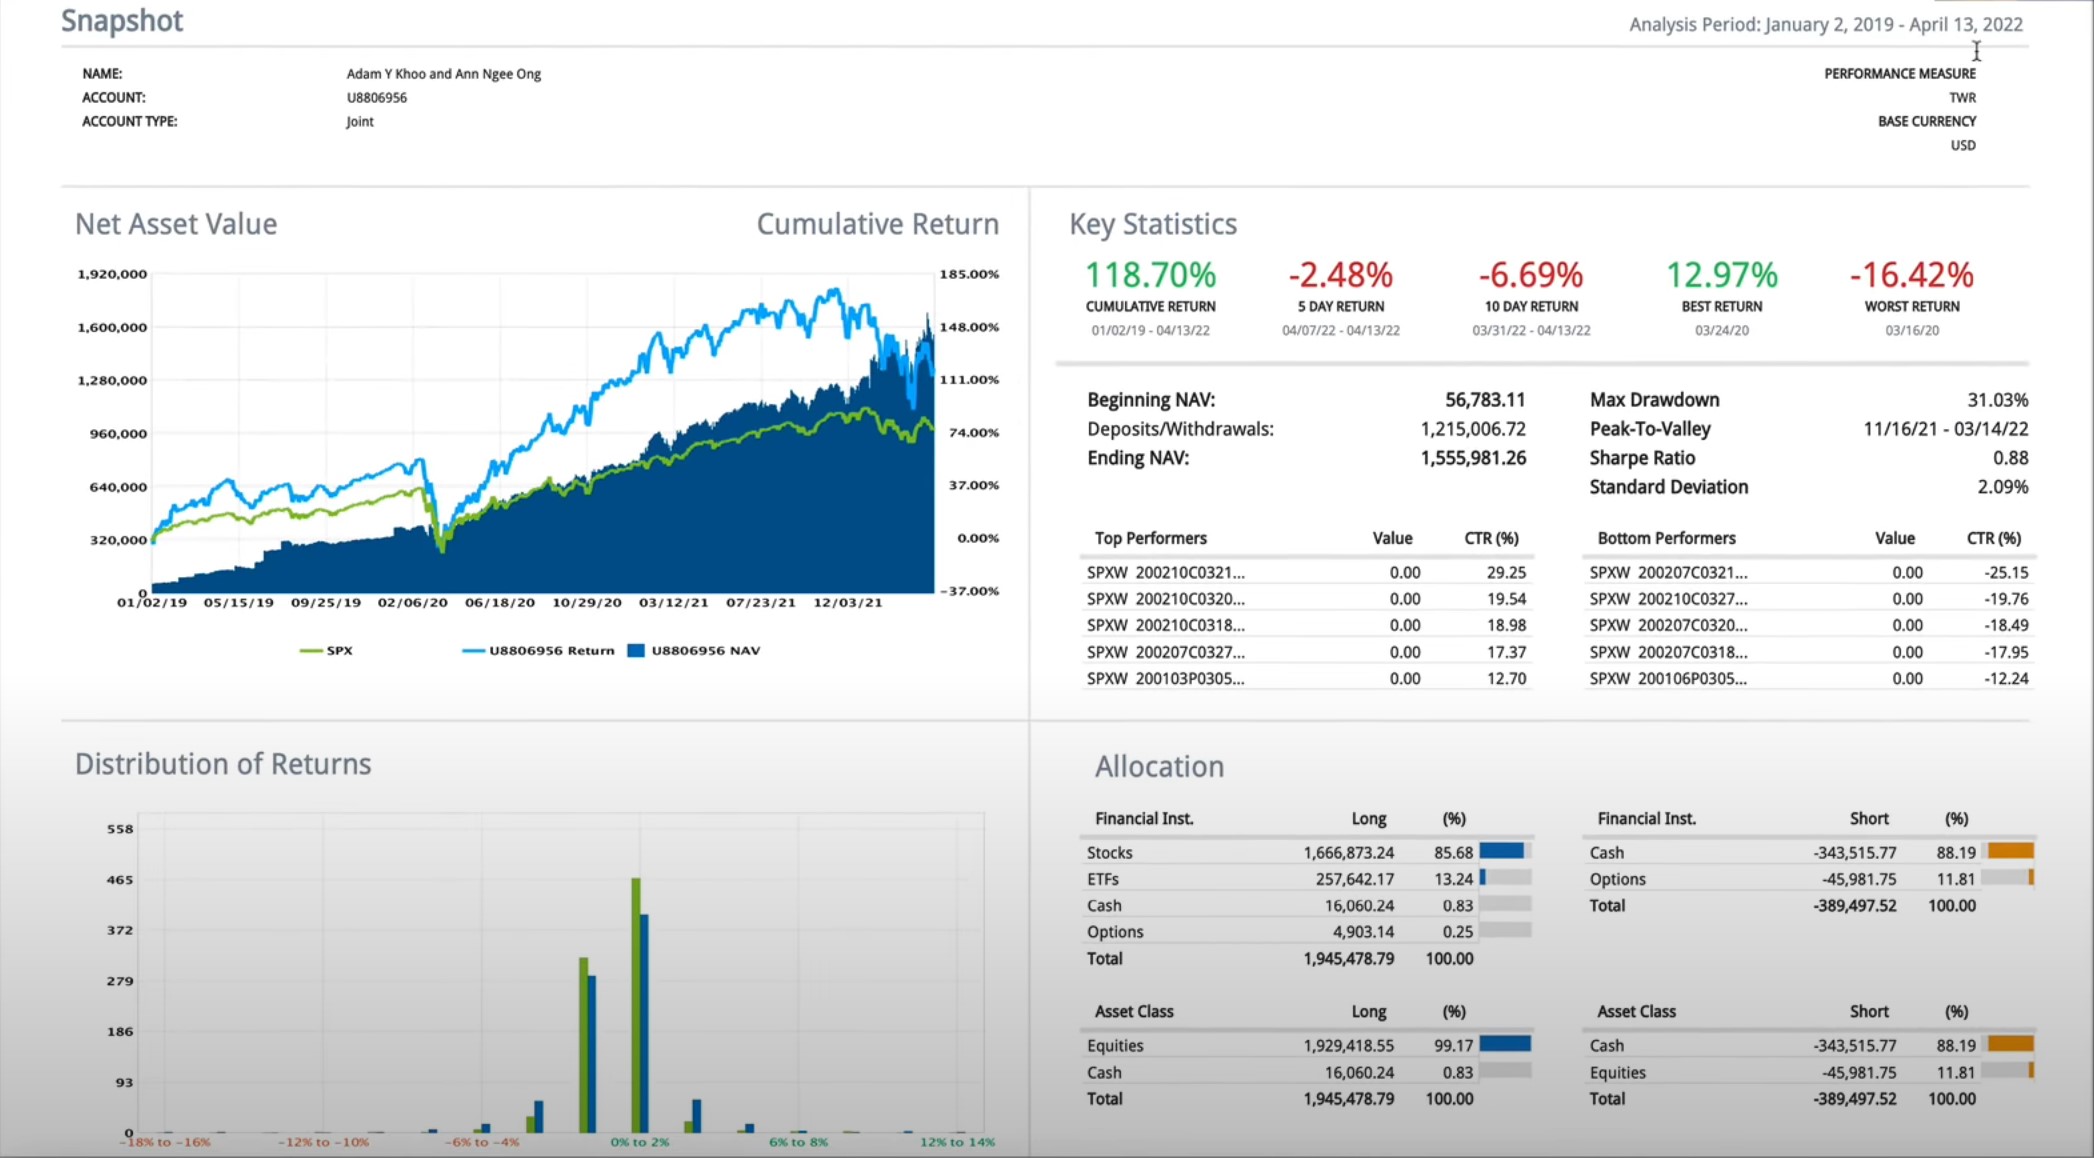
This is my portfolio performance for the last 3 years, from January 2019 to April 2022. The blue line is my equity curve and the green line is the S&P 500.
As you can see, in the short term, I'm underperforming the S&P 500 but if you look at the longer-term over the last three years, you can see that I outperformed the S&P 500.
During the Covid-19 market crash, my portfolio went down as well — it can't go up all the time. It has to go down to go higher, and in the last 3 years, I'm up about 118%. That's roughly a 39% return a year on average.
As an investor your portfolio is kind of like the markets; they don't go up in a straight line like that, and neither will your portfolio, it's impossible. If you see anyone's portfolio go up in a constant straight line, it's definitely a scammer like Bernie Madoff.
So in reality, your portfolio is like the markets, it has to breathe in in order to breathe out. You know something, the deeper it breathes in, the further it'll breathe out, provided you're holding great companies.
Why I'm Feeling EXCITED Right Now
While many retail investors may be feeling concerned or lousy about the markets, I can tell you I'm actually feeling very very excited right now. Let me tell you why.
You see the way I've been making money over the years is that I buy great companies when they are selling at a big discount to their intrinsic value. Usually, only a few great companies will be undervalued, but very rarely will many great companies be undervalued. It's happening right now, and it's extremely rare the only time I've seen this happen was during the 2008-2009 Great Financial Crisis and during the Trade War in 2018 for some companies, and of course the Covid crash in March 2020.
During those times, many great companies were undervalued so it's really rare that this happens and it's happening right now. A lot of good companies are very undervalued and that's what's getting me excited because every time this has happened in the past and I took advantage of it by adding shares, that's when I made the MOST MONEY.
How do I define a great company?
It's one that is able to consistently grow its sales, profits, and cash flow, over the long run for at least the last 5 to 10 years. These are companies that have got little or no competition, they've got a wide economic moat, a sustainable competitive advantage, and very low debt — these are great companies.
Here are a few examples of some great companies that are very undervalued now.
1. Amazon (AMZN)
First on the list would be Amazon(AMZN). Amazon has an intrinsic value of about $3,668.
(If you want to learn how to calculate intrinsic value, do take our Value Momentum Investing™ course or you can take a CFA where you learn how to do a discounted cash flow analysis.)
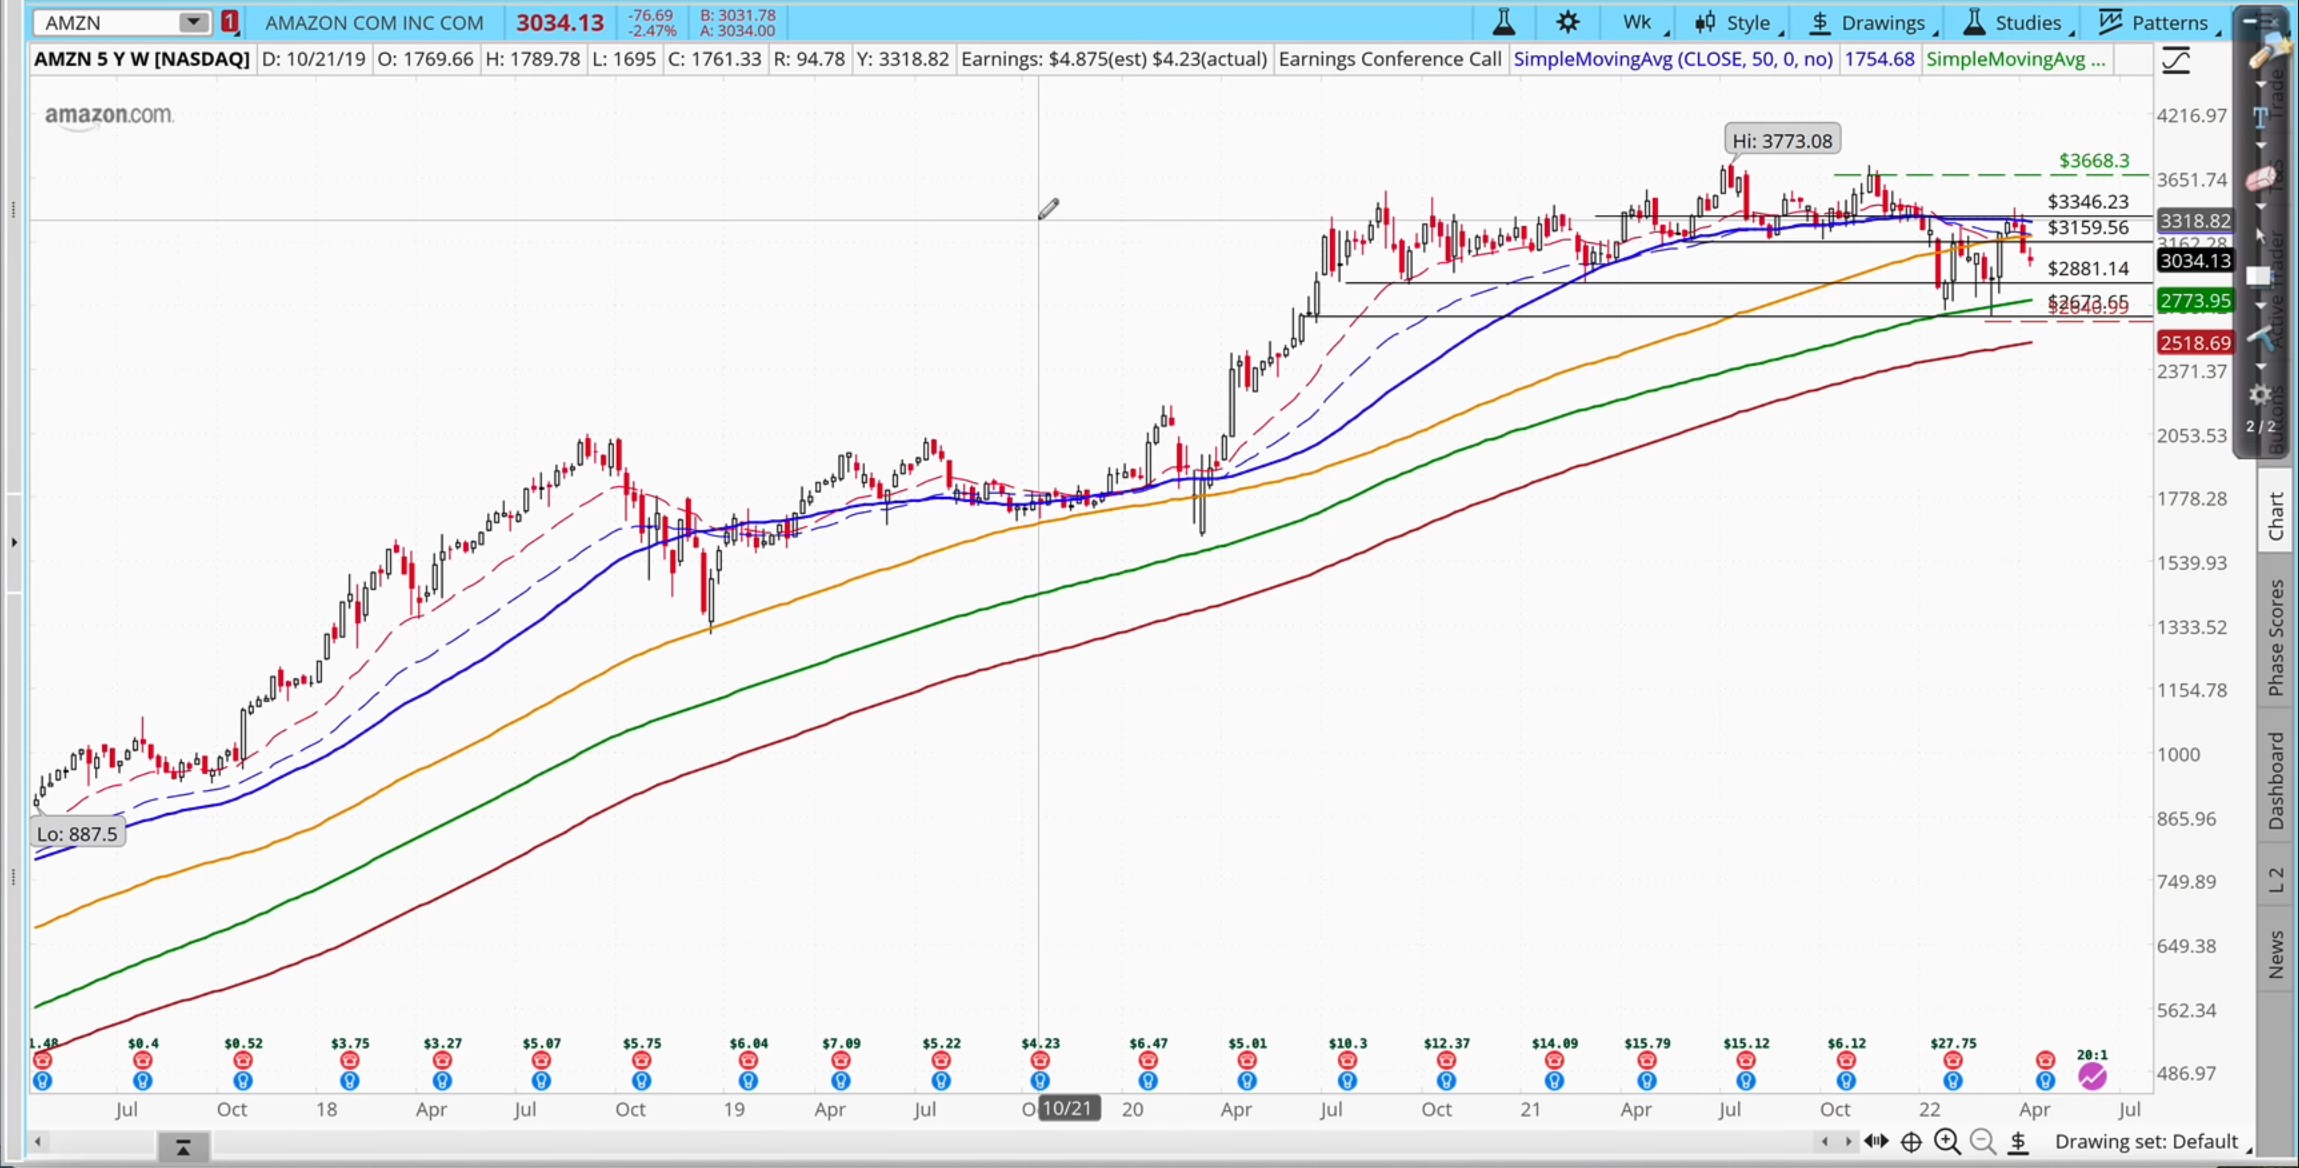
Amazon is worth roughly about $3,600 and it's currently selling at $3,000 so it's 18% undervalued. If you take a look again at the long-term history of Amazon right now from a chart perspective, you can see that it actually hit the 150 moving average on weekly candles.
How often does this happen? Not that often. You can see that it's not that often that it even touches the 150-day moving average. This has only happened very rarely, in fact, it's only happened twice in 10 years. So it's an extremely rare opportunity to buy Amazon so cheaply.
Now some people think that Amazon is expensive because they look at a P/E ratio.
Don't be fooled by Amazon's P/E ratio which is 46 times earnings. So people say "Hey that's really high," don't be fooled. For Amazon, you cannot look at the P/E ratio which is based on net income, because Amazon artificially depresses its earnings. They show very low earnings so they don't pay much taxes. The other reason of course is because they make a lot of money but instead of letting it flow to the bottom line, they throw it back into a lot of heavy investments to strengthen their competitive advantage.
So for Amazon, you can't look at profits. You have to look at operating cash flow or you can look at the price to sales ratio which is a more accurate valuation measure. If you look at the price to sales ratio
of Amazon it's only a 3.32 price to sales ratio. Now in comparison, Tesla (TSLA) has a price to sales ratio of 18 times, Nvidia (NVDA)has a price to sales ratio of 20 times, and Twitter (TWTR) has a price to sales ratio of 7 times.
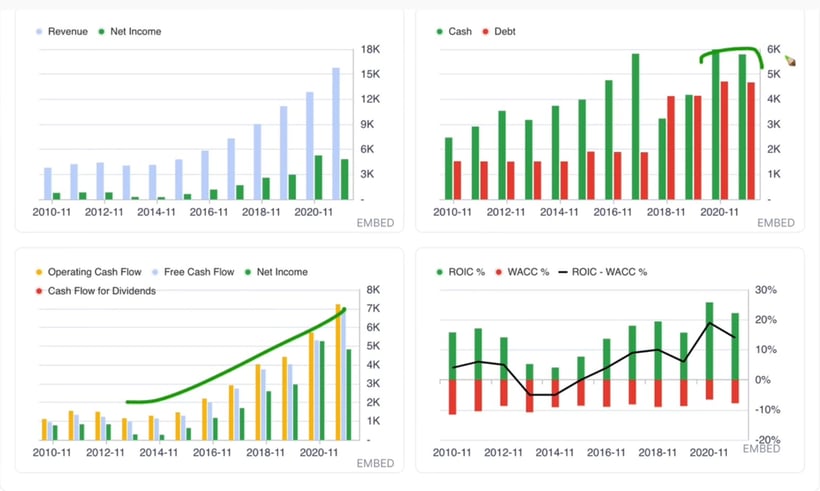
So relatively, Amazon is freaking dirt cheap. Amazon is a company that consistently, over the long run, grows its revenue.
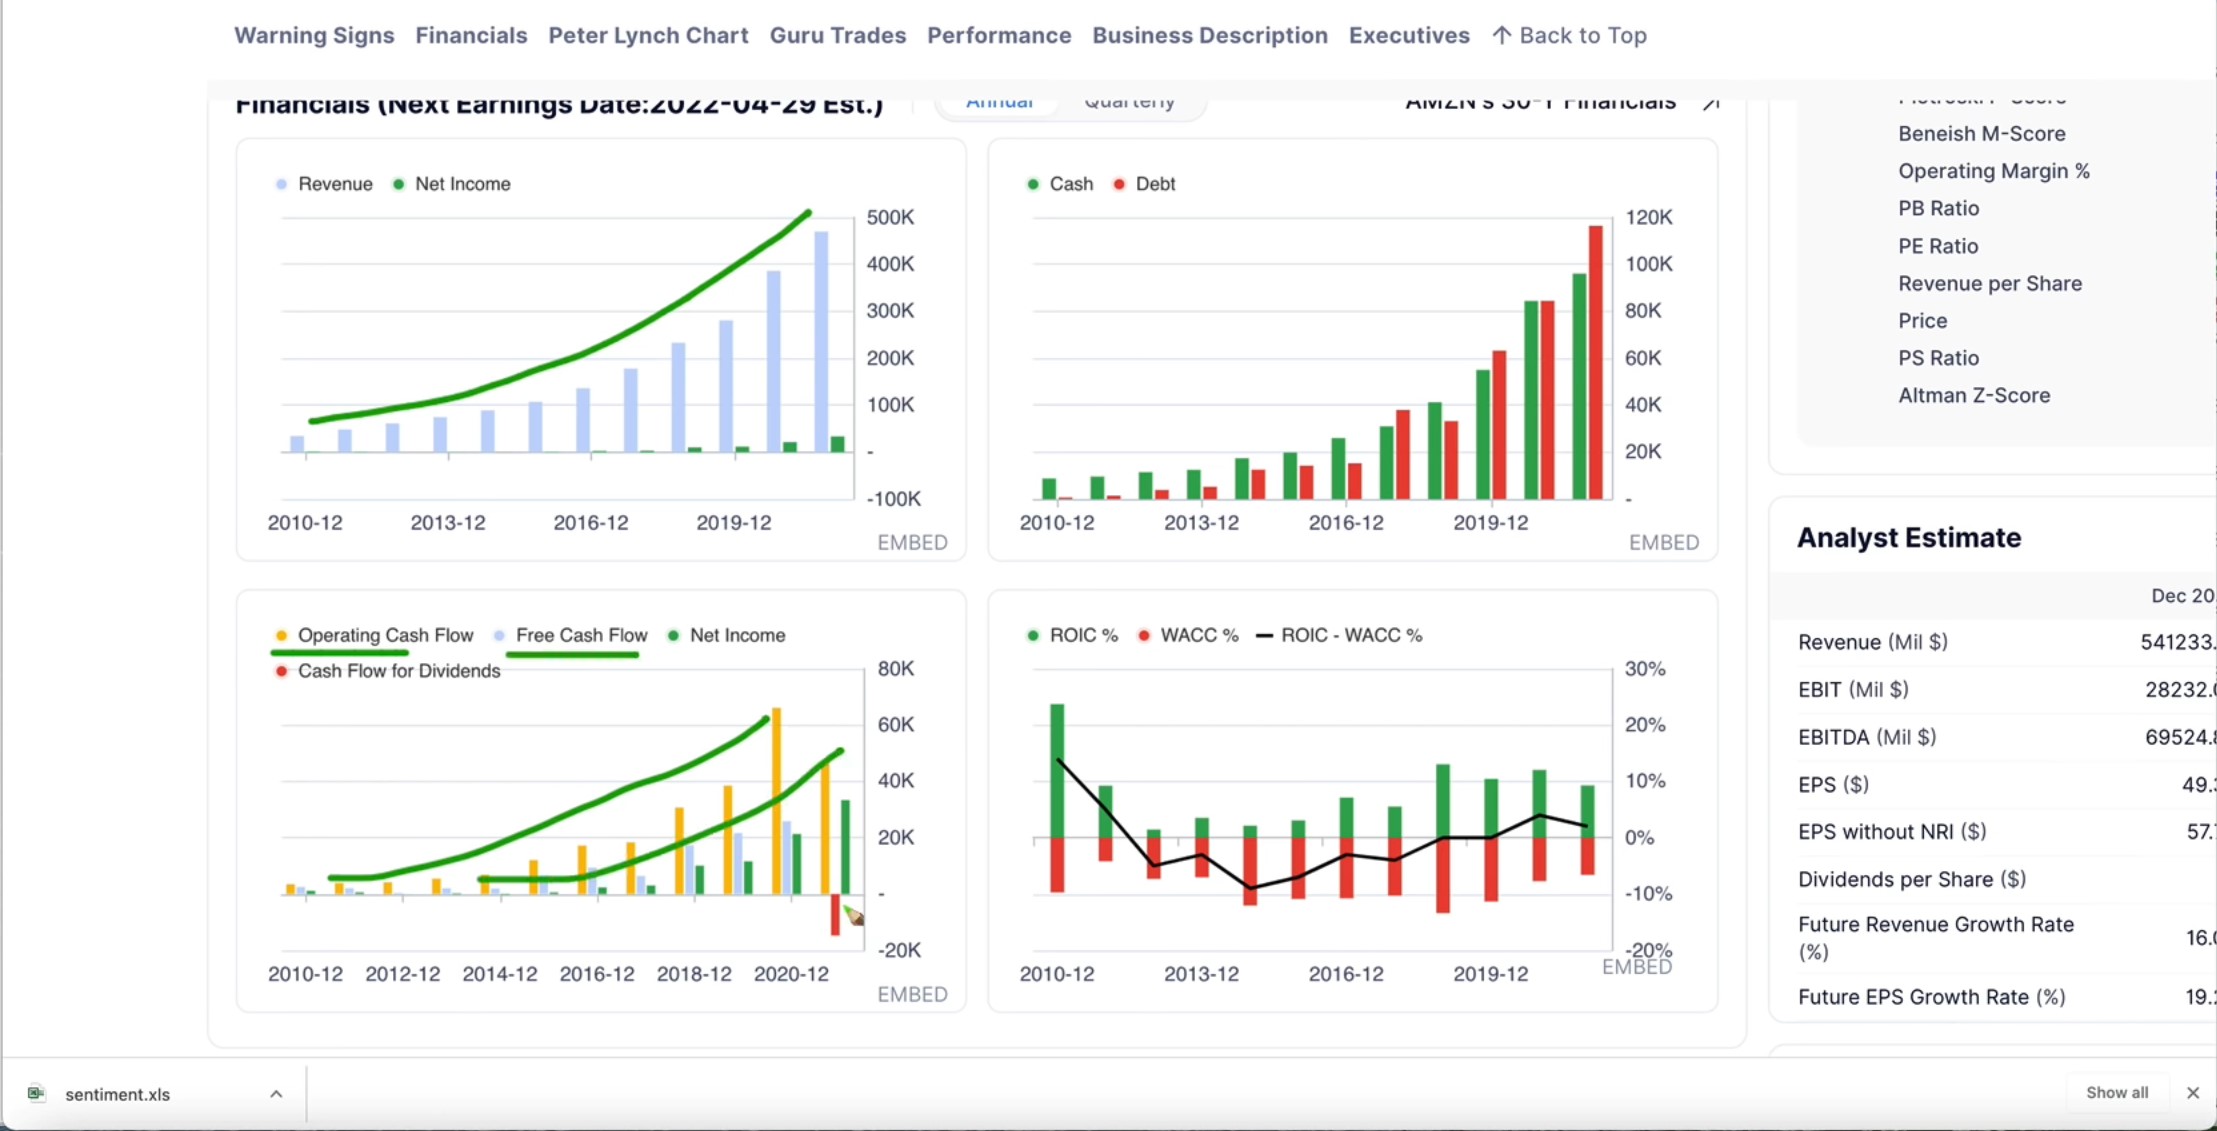
Take a look at that. Revenue growing consistently in the long run, operating cash flow growing consistently, as well as free cash flow growing consistently. There was a drop in the last 12 months on purpose because they invested heavily in capital expenditures, but that's temporary, so once that is over their free cash flow will explode once again.
So again, Amazon is one example of a good company that is dirt cheap. I've been consistently buying Amazon at these levels.
2. Adobe (ADBE)
Another example is Adobe (ADBE).
So if you look at Adobe, it passes the steps or criteria of a great business. It has got hardly any competition that is able to offer the same suite of products as it does, it controls 90% market share of the professional creative market.
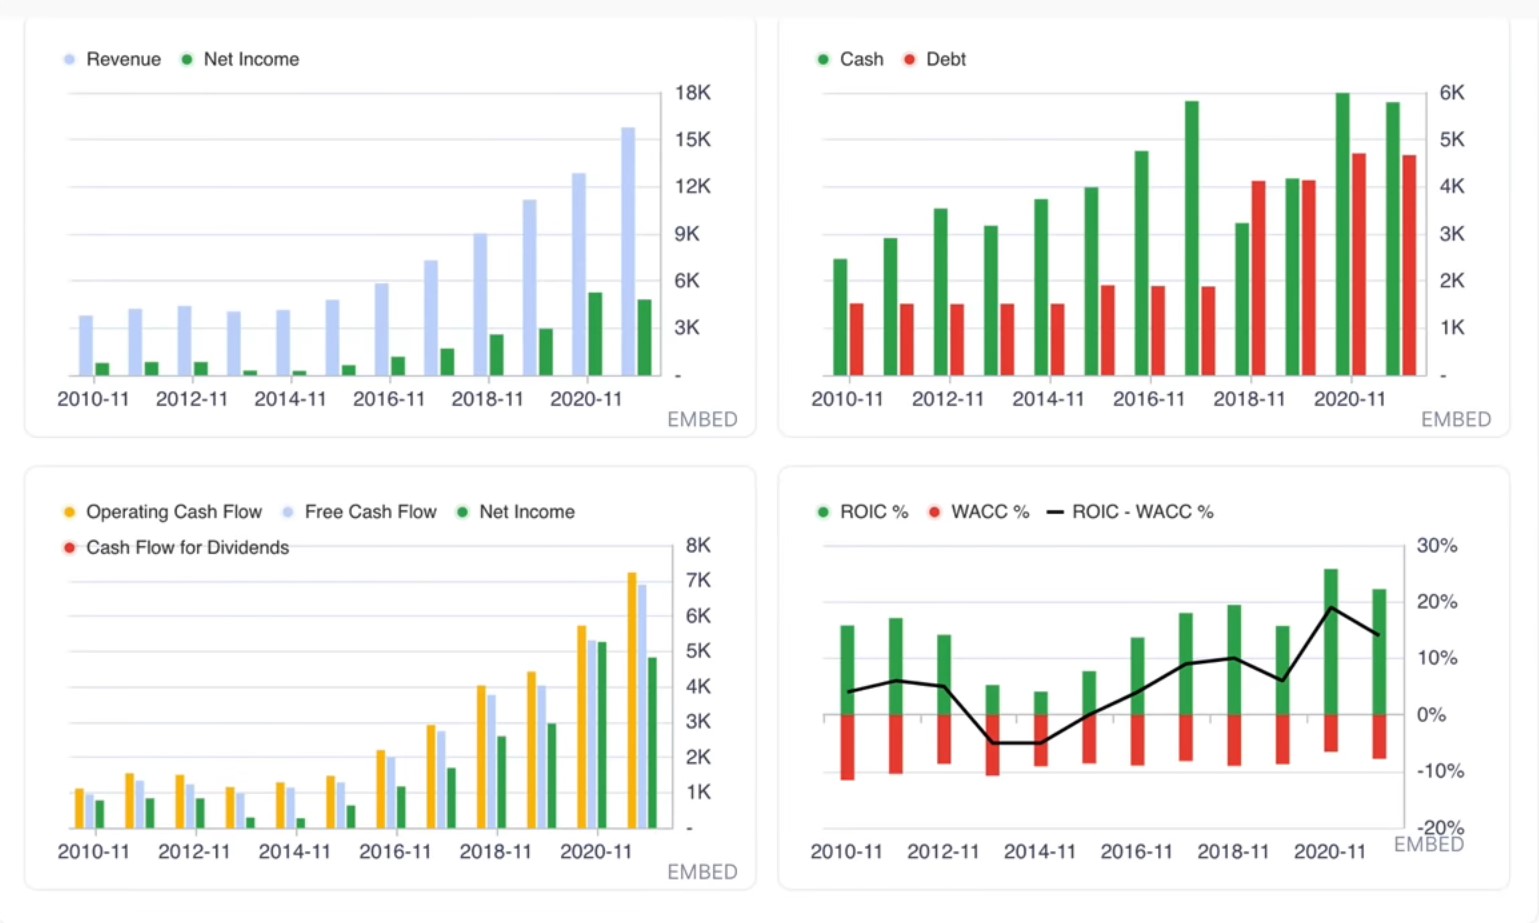
In the long run, the sales revenue is increasing, profits are increasing consistently, and so is their free cash flow, and they have a relatively very low debt compared to the amount of cash that they own.
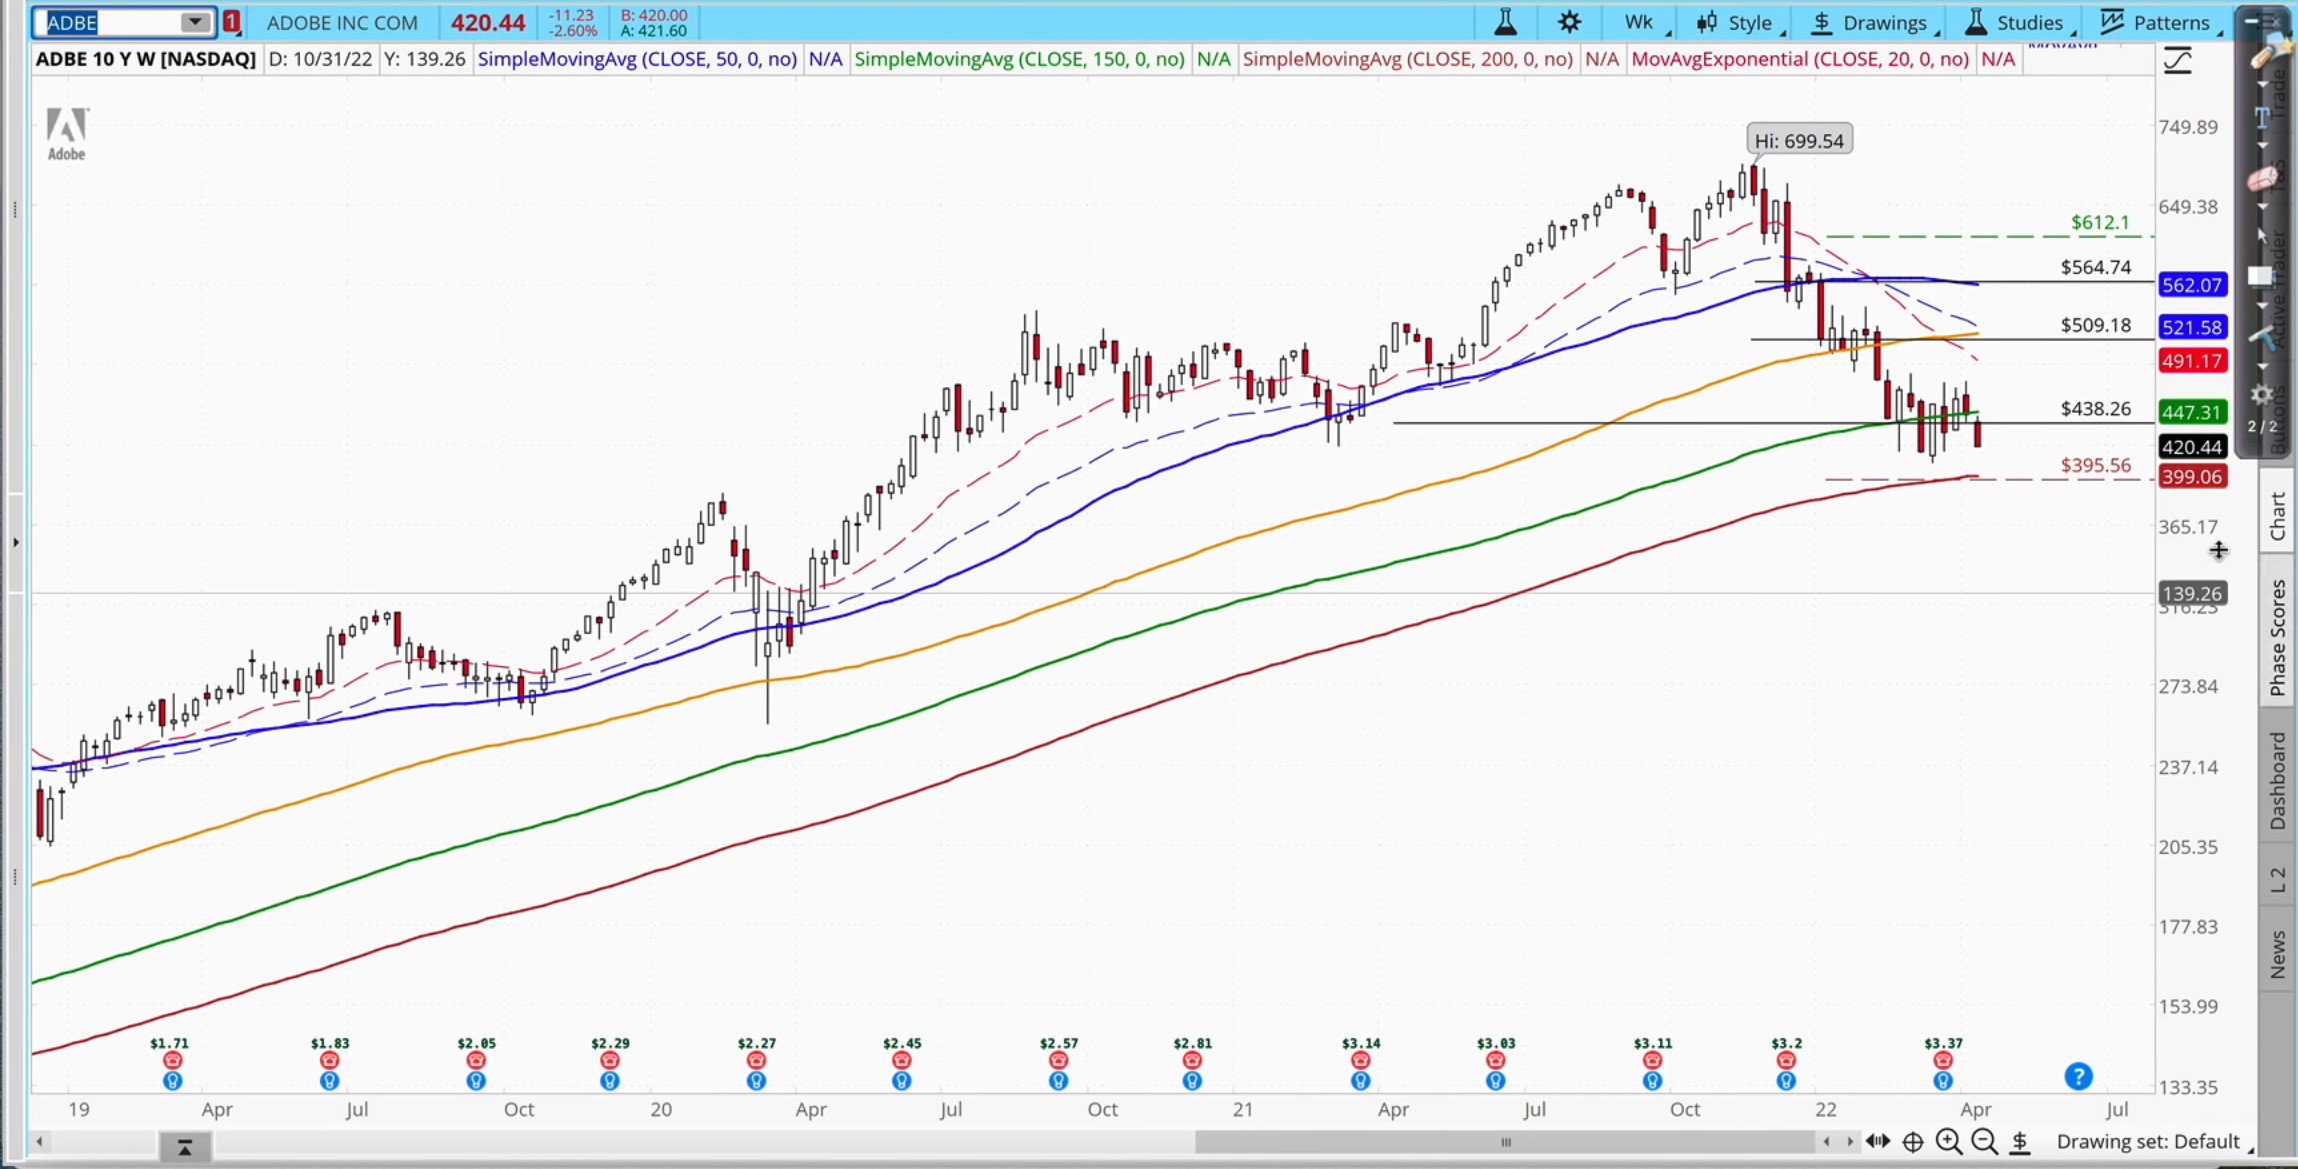
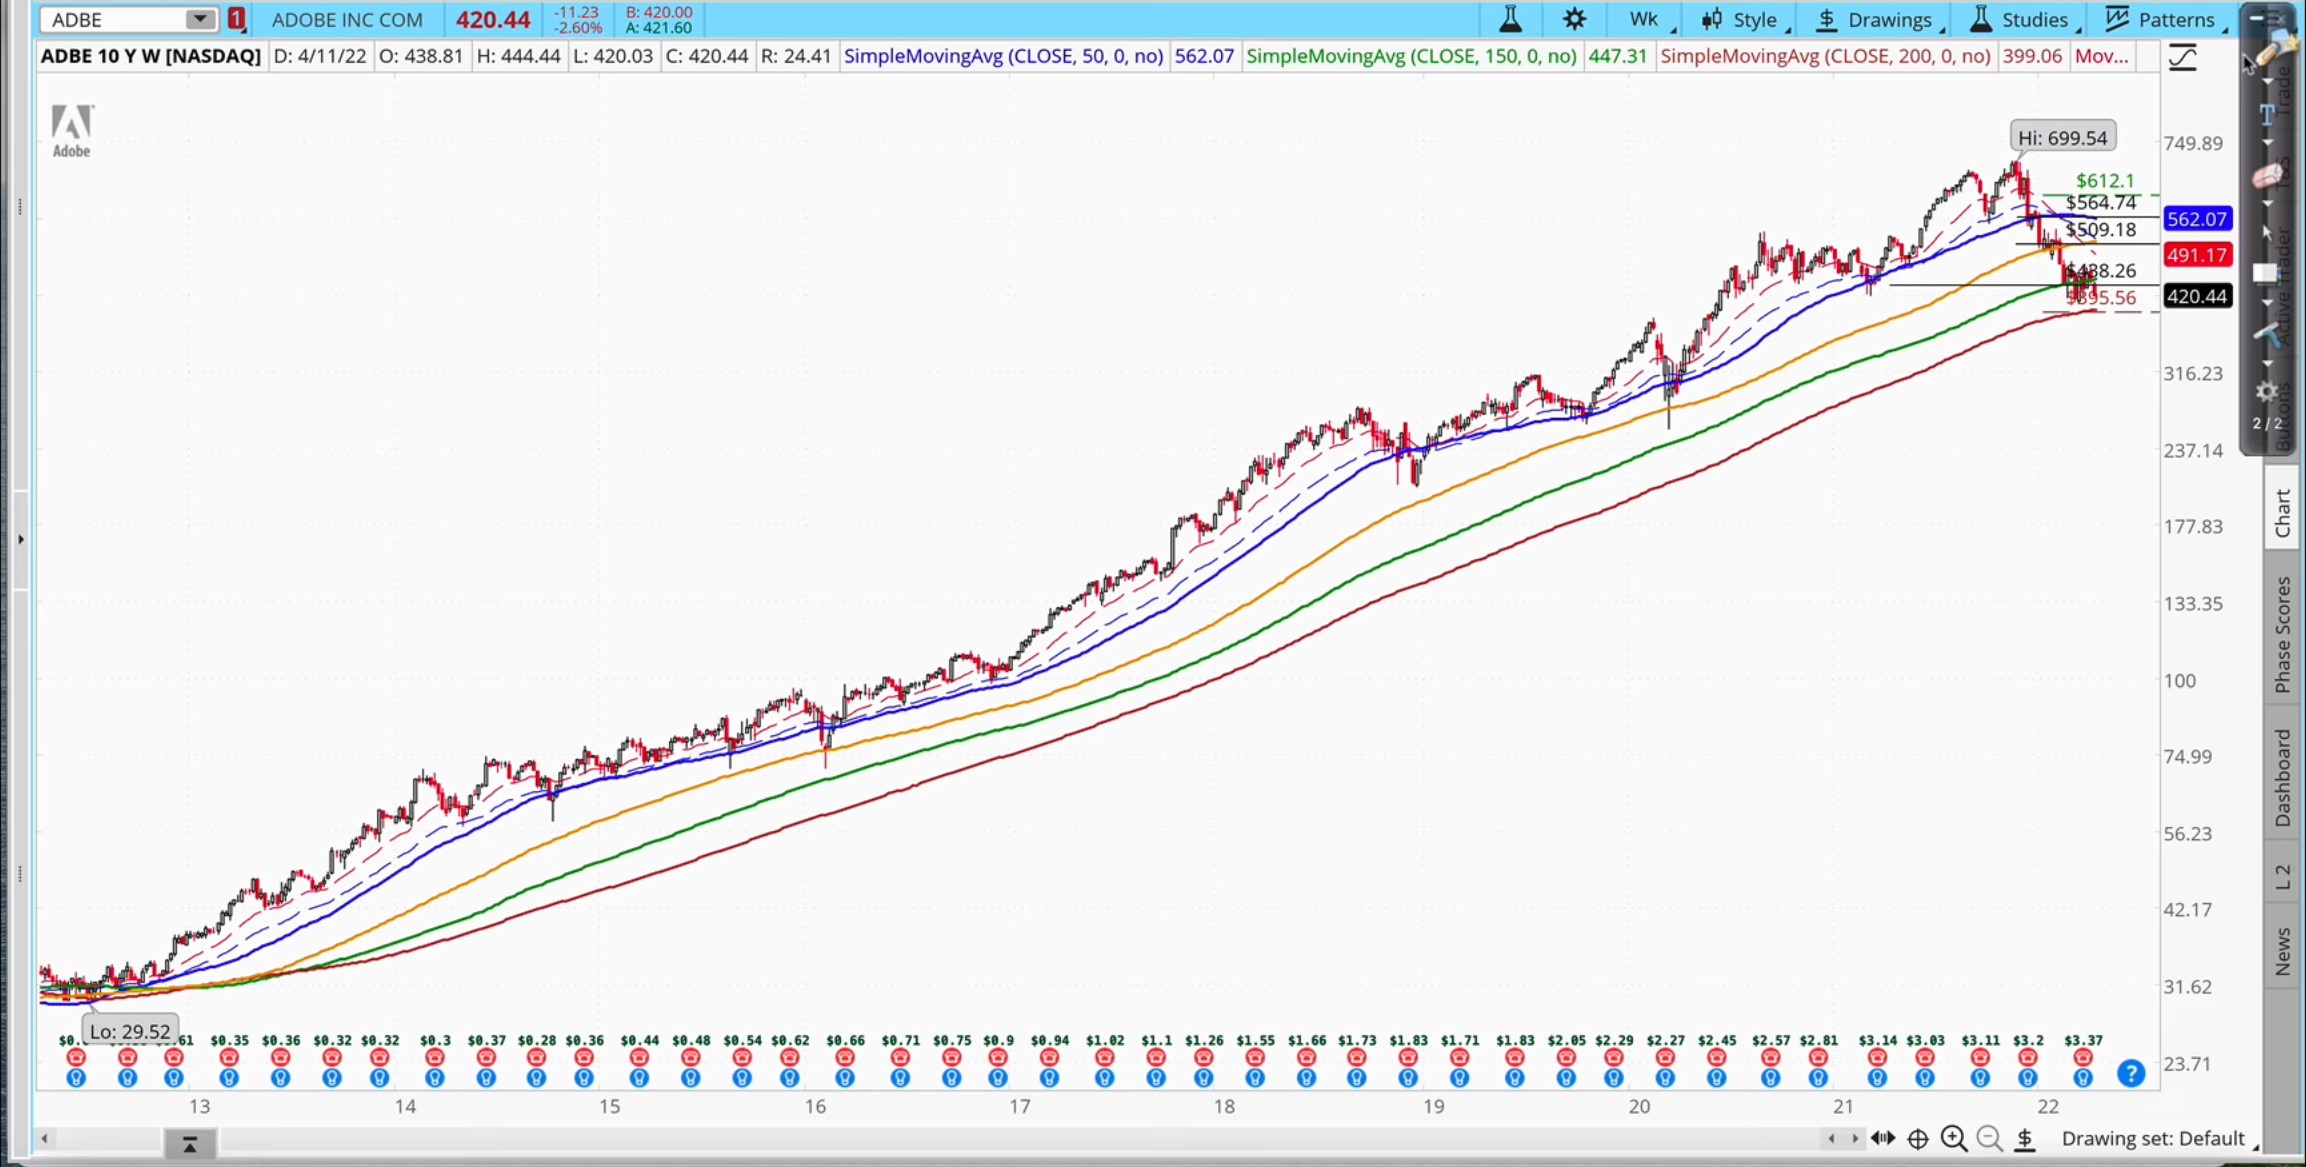
If you look at the charts, the intrinsic value of adobe is $612. My valuations are actually very conservative. If you actually look at Morningstar (www.morningstar.com) that does valuation, theirs is a lot higher than mine, so mine is already with very low conservative projections. But even then, I get a valuation of $612 — that's what it's worth, but it's now selling at $420 so it's 32% undervalued.
How often does this happen? Very rarely.
If you look at the chart of Adobe going back 10 years, you can see right now that Adobe has retraced to the green line, the 150 moving average on weekly candles.
How often has this happened in 10 years?
It has only happened once, in fact, it was close to the 150MA in the 2020 crash and again it happened back in 2016, where it went near the 150MA. So it only happened again twice in 10 years — very rare for it to be SO DARN CHEAP, and again there are many other examples.
3. Facebook (META)
Let's look at Facebook (META).
If you look at the sales and profits it's crazy — sales are growing consistently, profits are growing consistently, and operating cash flow growing consistently. In fact, their free cash flow increased 60% year on year all the way up, so this is a great business, no doubt about it.
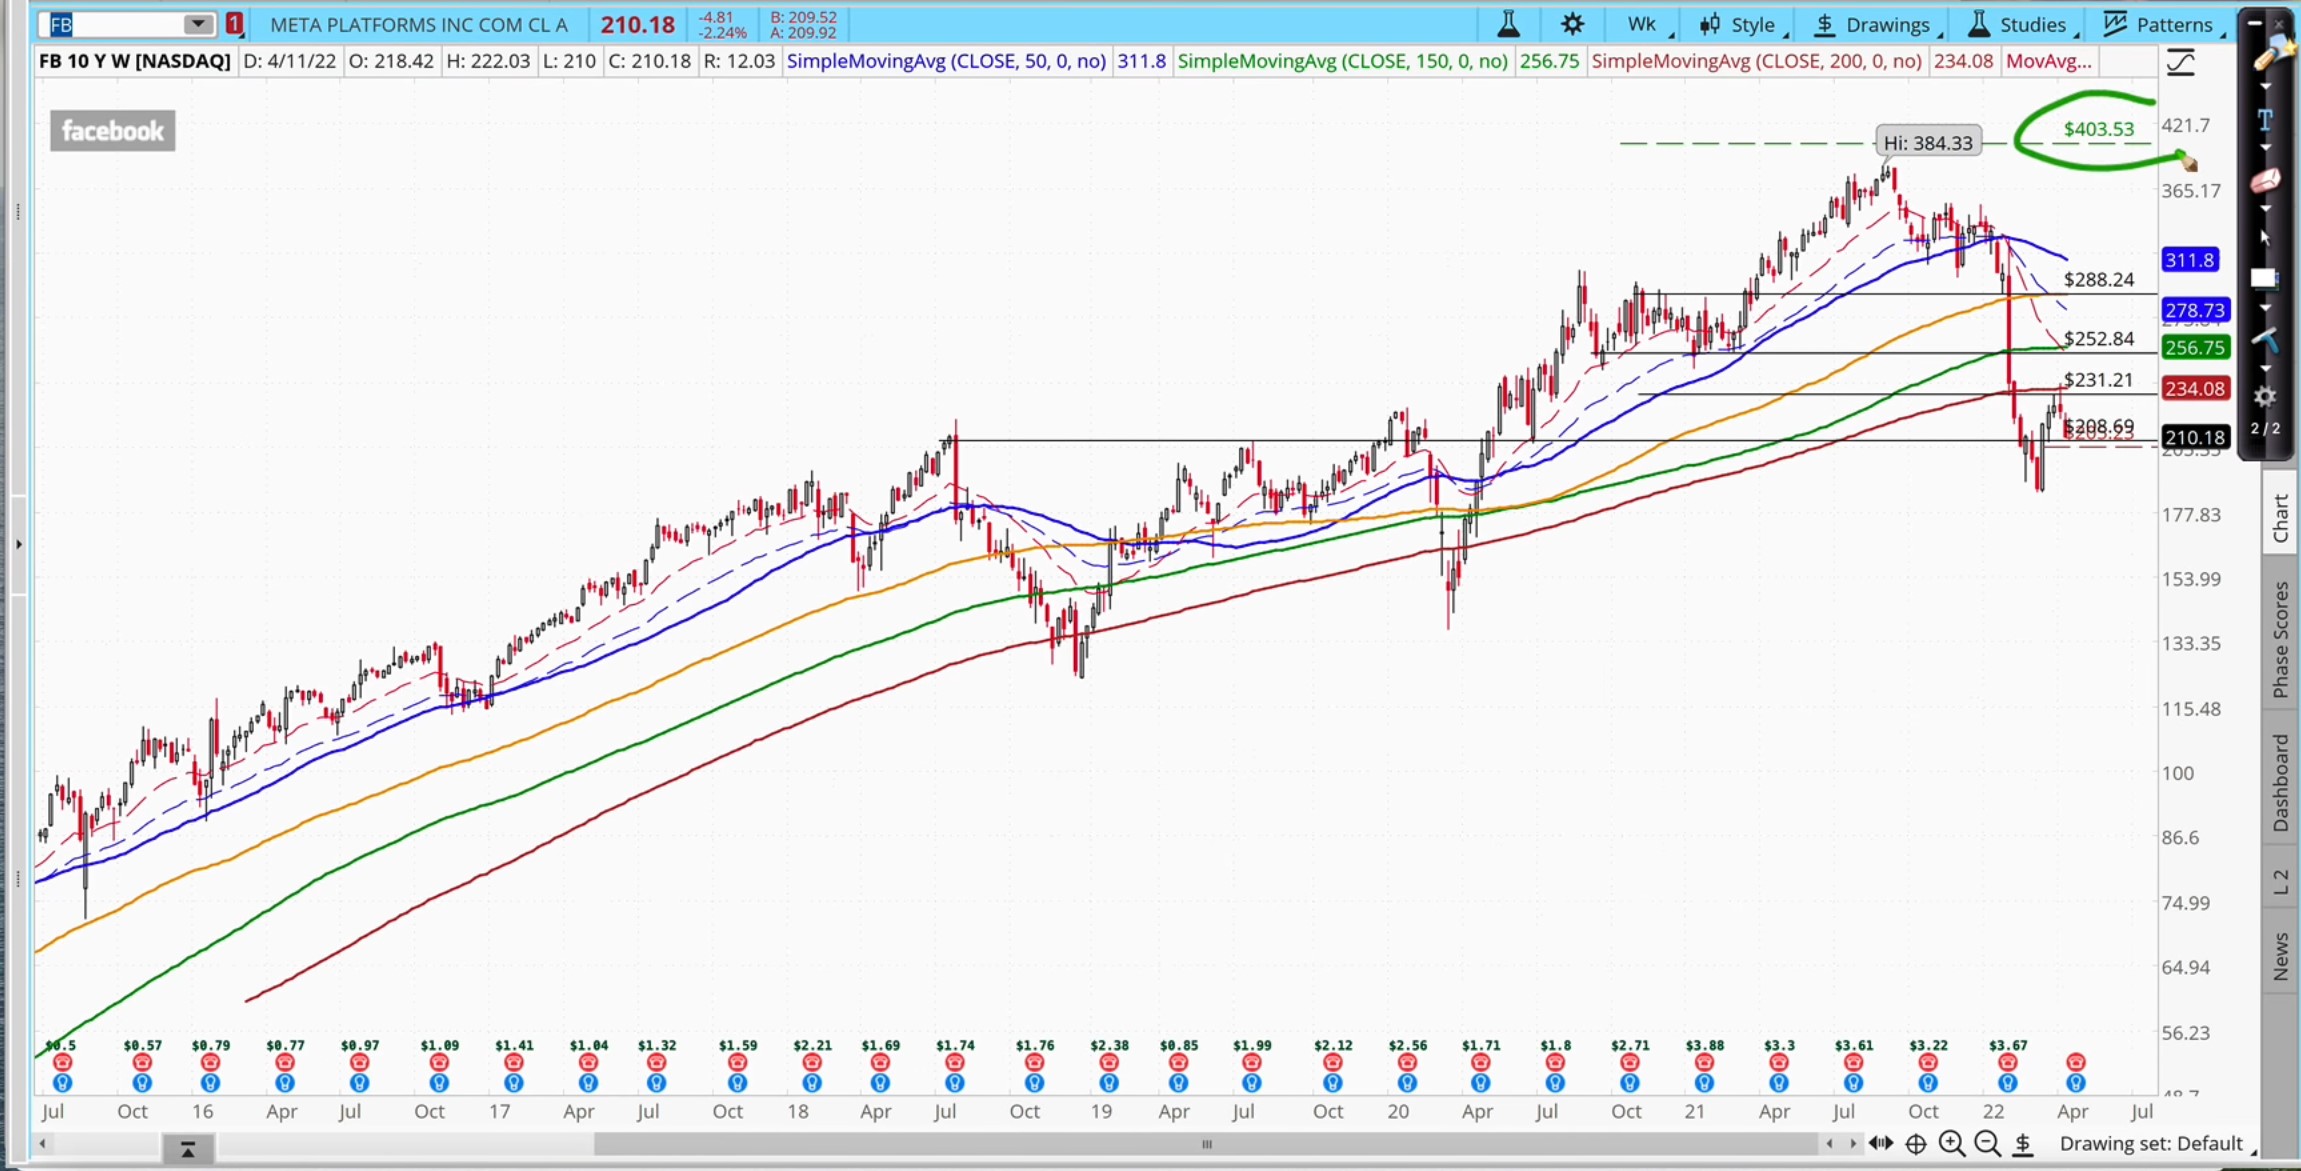
However, their stock price got hammered right because of all this negative sentiment and overreaction to certain kinds of news. The intrinsic value of Facebook conservatively is about $403 and this doesn't take into account their METAVERSE project, which to me is a bonus— so even if it fails, who cares? This valuation is based on the free cash flow generated from its legacy applications like Instagram, Facebook, and WhatsApp.
It is currently trading at around $210 so it's like almost at a 50% DISCOUNT. On the charts, you can see that Facebook is trading below its 200 moving average on the weekly candles.
How often does this happen? Not that often.
The only time this happened was during the Covid crash and during the Cambridge Analytica scandal back in 2018. So you can see a huge upside potential back to its fair value and beyond, as Facebook starts to grow.
On a P/E ratio basis, Facebook is selling at 15 times earnings. When they are growing their cash flow and earnings by 40%, 50%, and 60%, so it is really dirt cheap now.
As always, this is NOT A RECOMMENDATION OR ADVICE for you to buy any of these stocks. I'm just telling this to you because this is how I think, this is how I invest. I'm sharing it purely for educational purposes, so please, if you want to invest in something you're going to have to do your own research, but I'm just sharing with you my thought process.
Now it's not just technology stocks that are undervalued. There are some really good businesses that are non-technology, especially those in the consumer discretionary sector for example; Domino's pizza, it's very undervalued right now, and also Starbucks and Nike. These are very good businesses that are undervalued as well.
So What's Causing The Market Sell-Off?
So what is causing this big sell-off in the markets?
Well of course you've got that Russia-Ukraine war, that's one thing. The other main thing is the rising long-term interest rates— the yield on the 10-year bond is rising.
When the long-term interest rate rises, it increases the discount rate used to value companies. So when the long-term interest rate goes up, the discount rate goes up, the intrinsic value goes down, but it only affects companies that are unprofitable now; so companies that have sales but no profits, (they expect to make profits in the future) would be the most badly affected by these higher long-term interest rates.
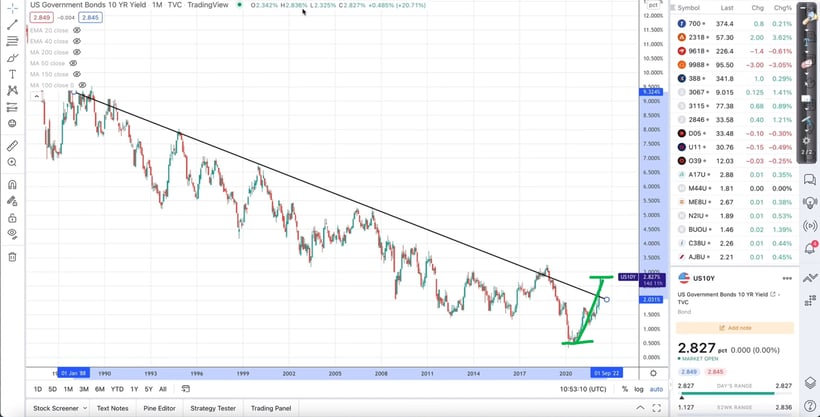
You can see over here the 10-year bond has been going up all the way right from 0.5% now to 2.8%.
How much higher will it go? My guess is it could go up to 3% to 3.5% but thereafter you can see the long term, it's on a downtrend, it will revert back down eventually. But it will still go higher in the short term. So again as this goes up, companies that are not making money that is unprofitable will get whacked the worst.
But then you may say, "But Adam in that case, Adobe's making money, Amazon's making money, Facebook's making money . . . Why are they going down?!"
Well because the baby is getting thrown out with the bathwater. So what I'm saying is that this is a
great opportunity to buy companies — only the good ones. Only the ones that are profitable because these are the ones that are going to bounce back up very strongly once the yields start to tip off and come back down. Companies that don't make money, that are unprofitable, and that are driven up purely by liquidity and the Fed— those may not come back or those may take a long time to come back up.
So a few examples of these companies to be careful about, are companies that are not consistently profitable, like Teledoc (TDOC). A lot of the companies in the ARK ETF are these kinds of companies, I've mentioned this before and that's why I said "Be careful of ARK ETF," many months ago.
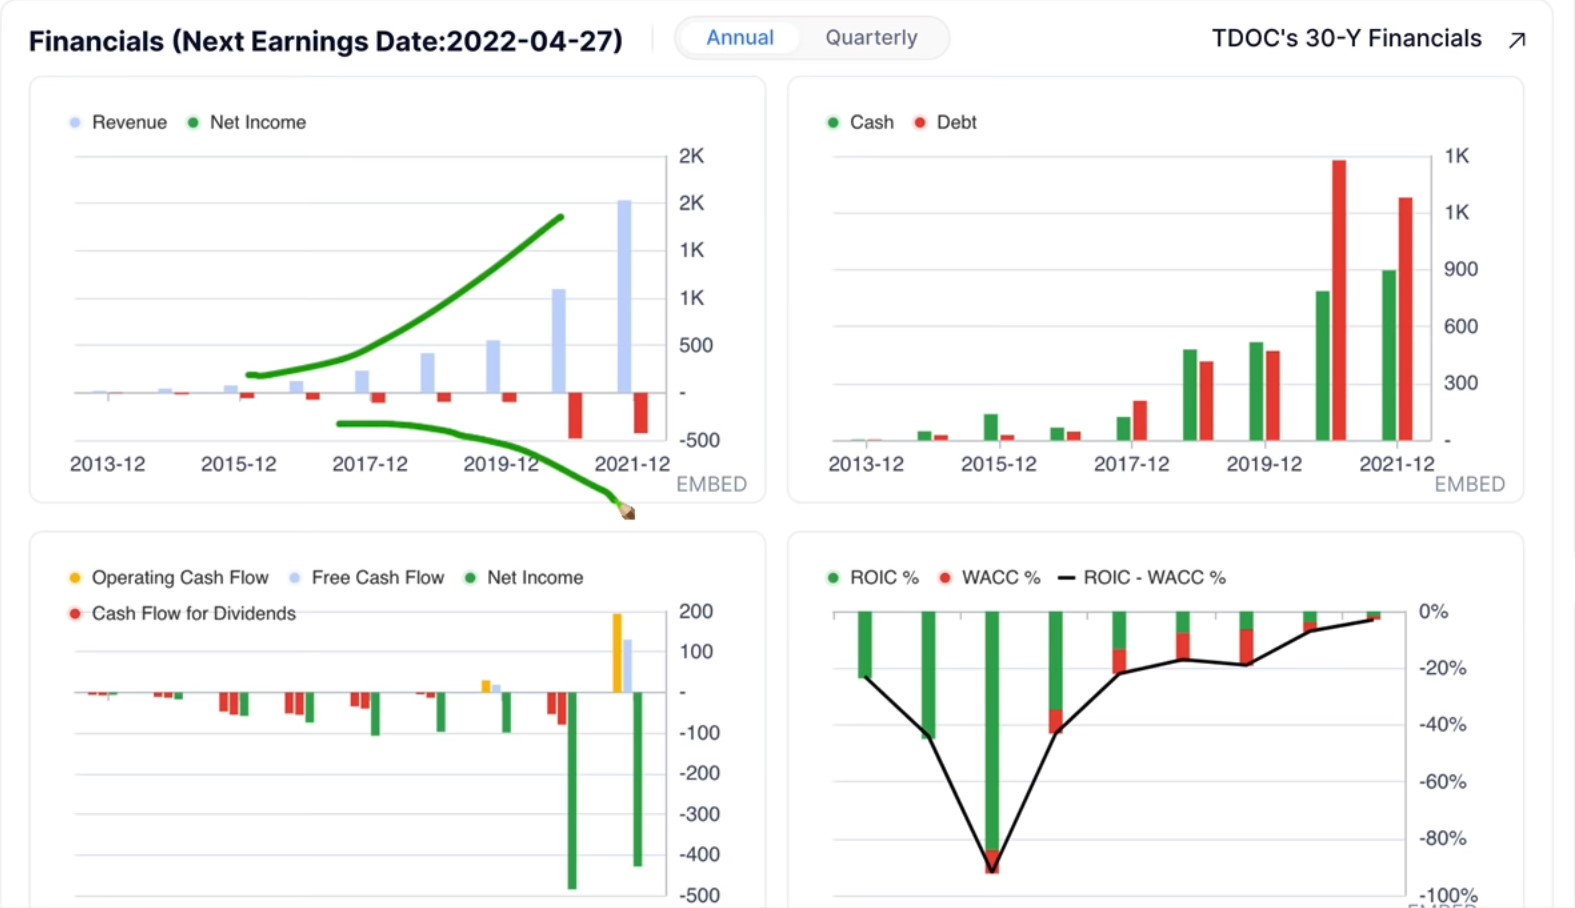
For example, if you look at Teledoc, it's one of those companies where sales are growing, but they're not making money! They are losing more and more money every single year. Their stock price is pumped up by liquidity, and without liquidity, it's worth nothing.
Another example is NIO. Of course, people are excited about electric vehicles, they're going to change the world. . . yeah, but ultimately is it making money?
No, it's not making money yet. Will it make money one day? Hope so, but we don't know. So again sales are going up, but you know they are losing money. Companies that can't survive without liquidity, take out liquidity and they'll all fall because there are no earnings, no cash flow, to back up the share price.
How Could We Buy Into The Current Market?
Now I'm not saying that the market is going to go up tomorrow. All I'm saying is that great companies are looking cheap, and as an investor, it's a great opportunity to buy stocks in my opinion.
As always, I tell my students to NEVER buy at one go— always buy in tranches, buy in stages, average in slow into the markets because it could still go down in the short term.
In fact, if you look at the charts again in the short term, we may still have a bit more downside possibly.
Why? because we closed in the bearish engulfing pattern, so we could go down and re-test those lows, you never know.
So what do I do as an investor myself?
So in my investment portfolio, great companies I already hold, I'll just continue to hold it because it's going to go up eventually, PLUS I add more shares along the way. But at the same time, when I see the market going down temporarily, I'll use OPTIONS to short the market and make some short-term profits during the short-term downtrend.
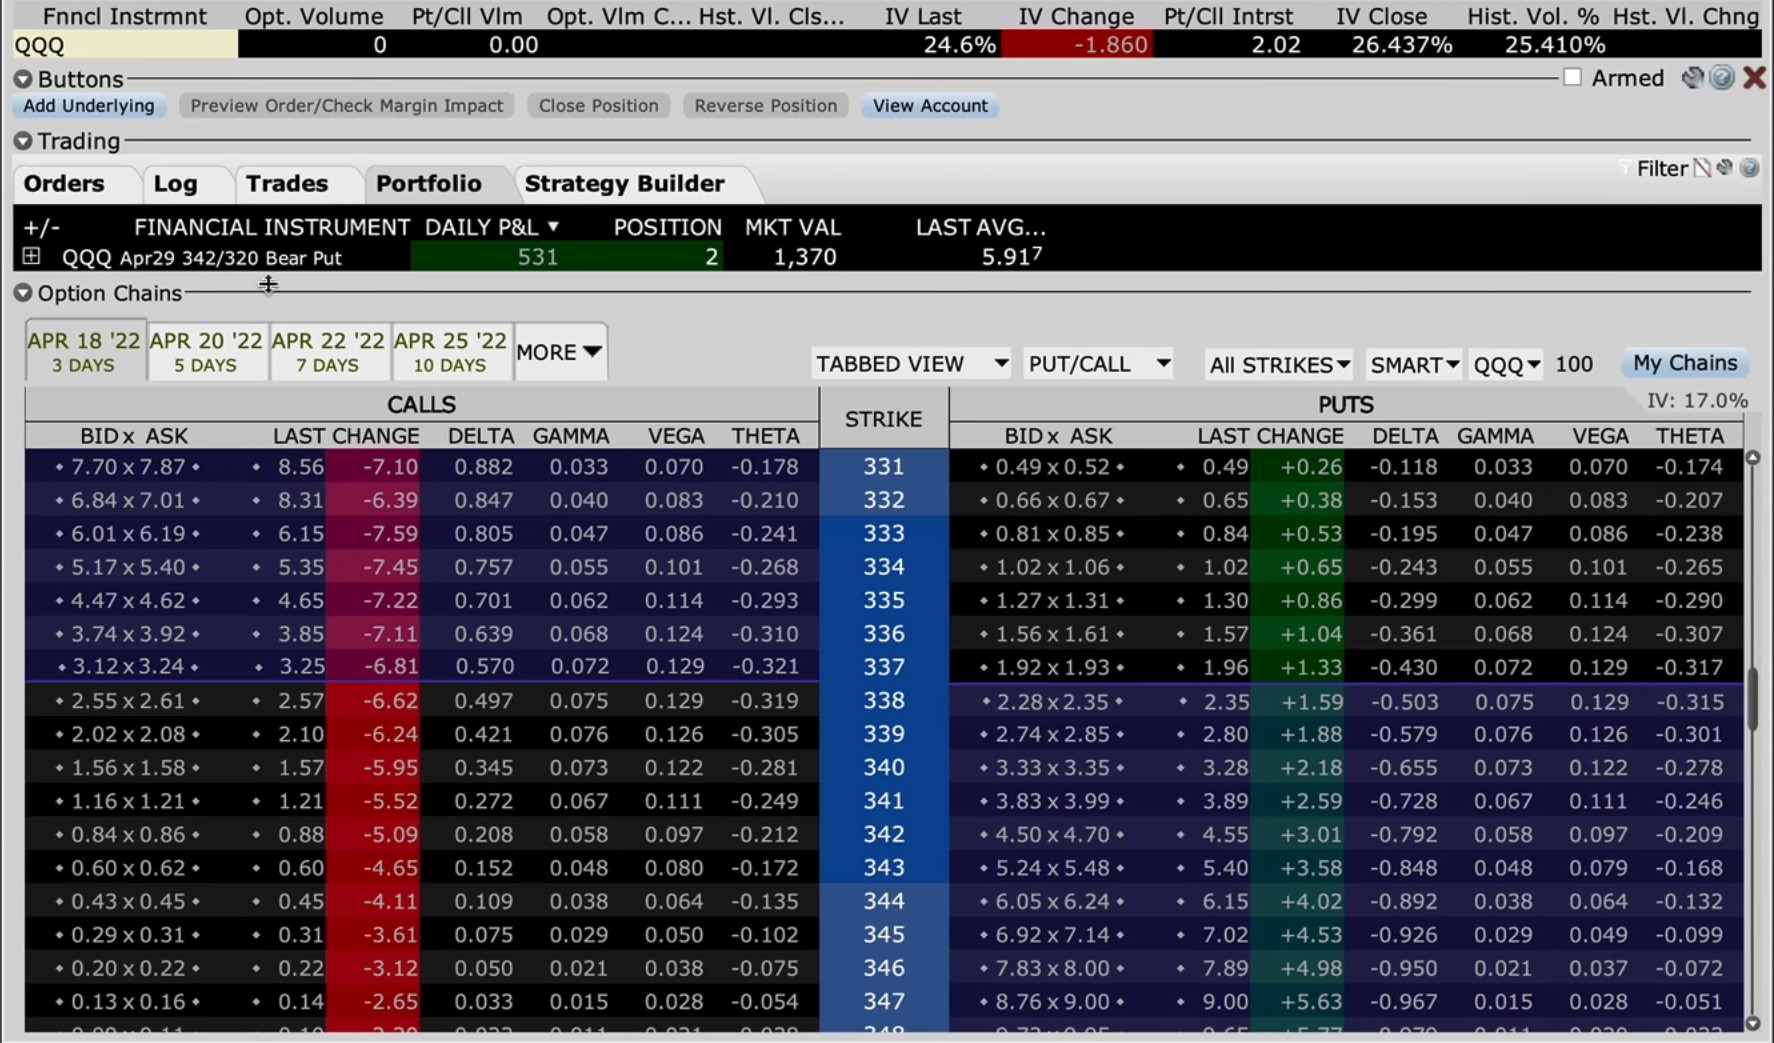
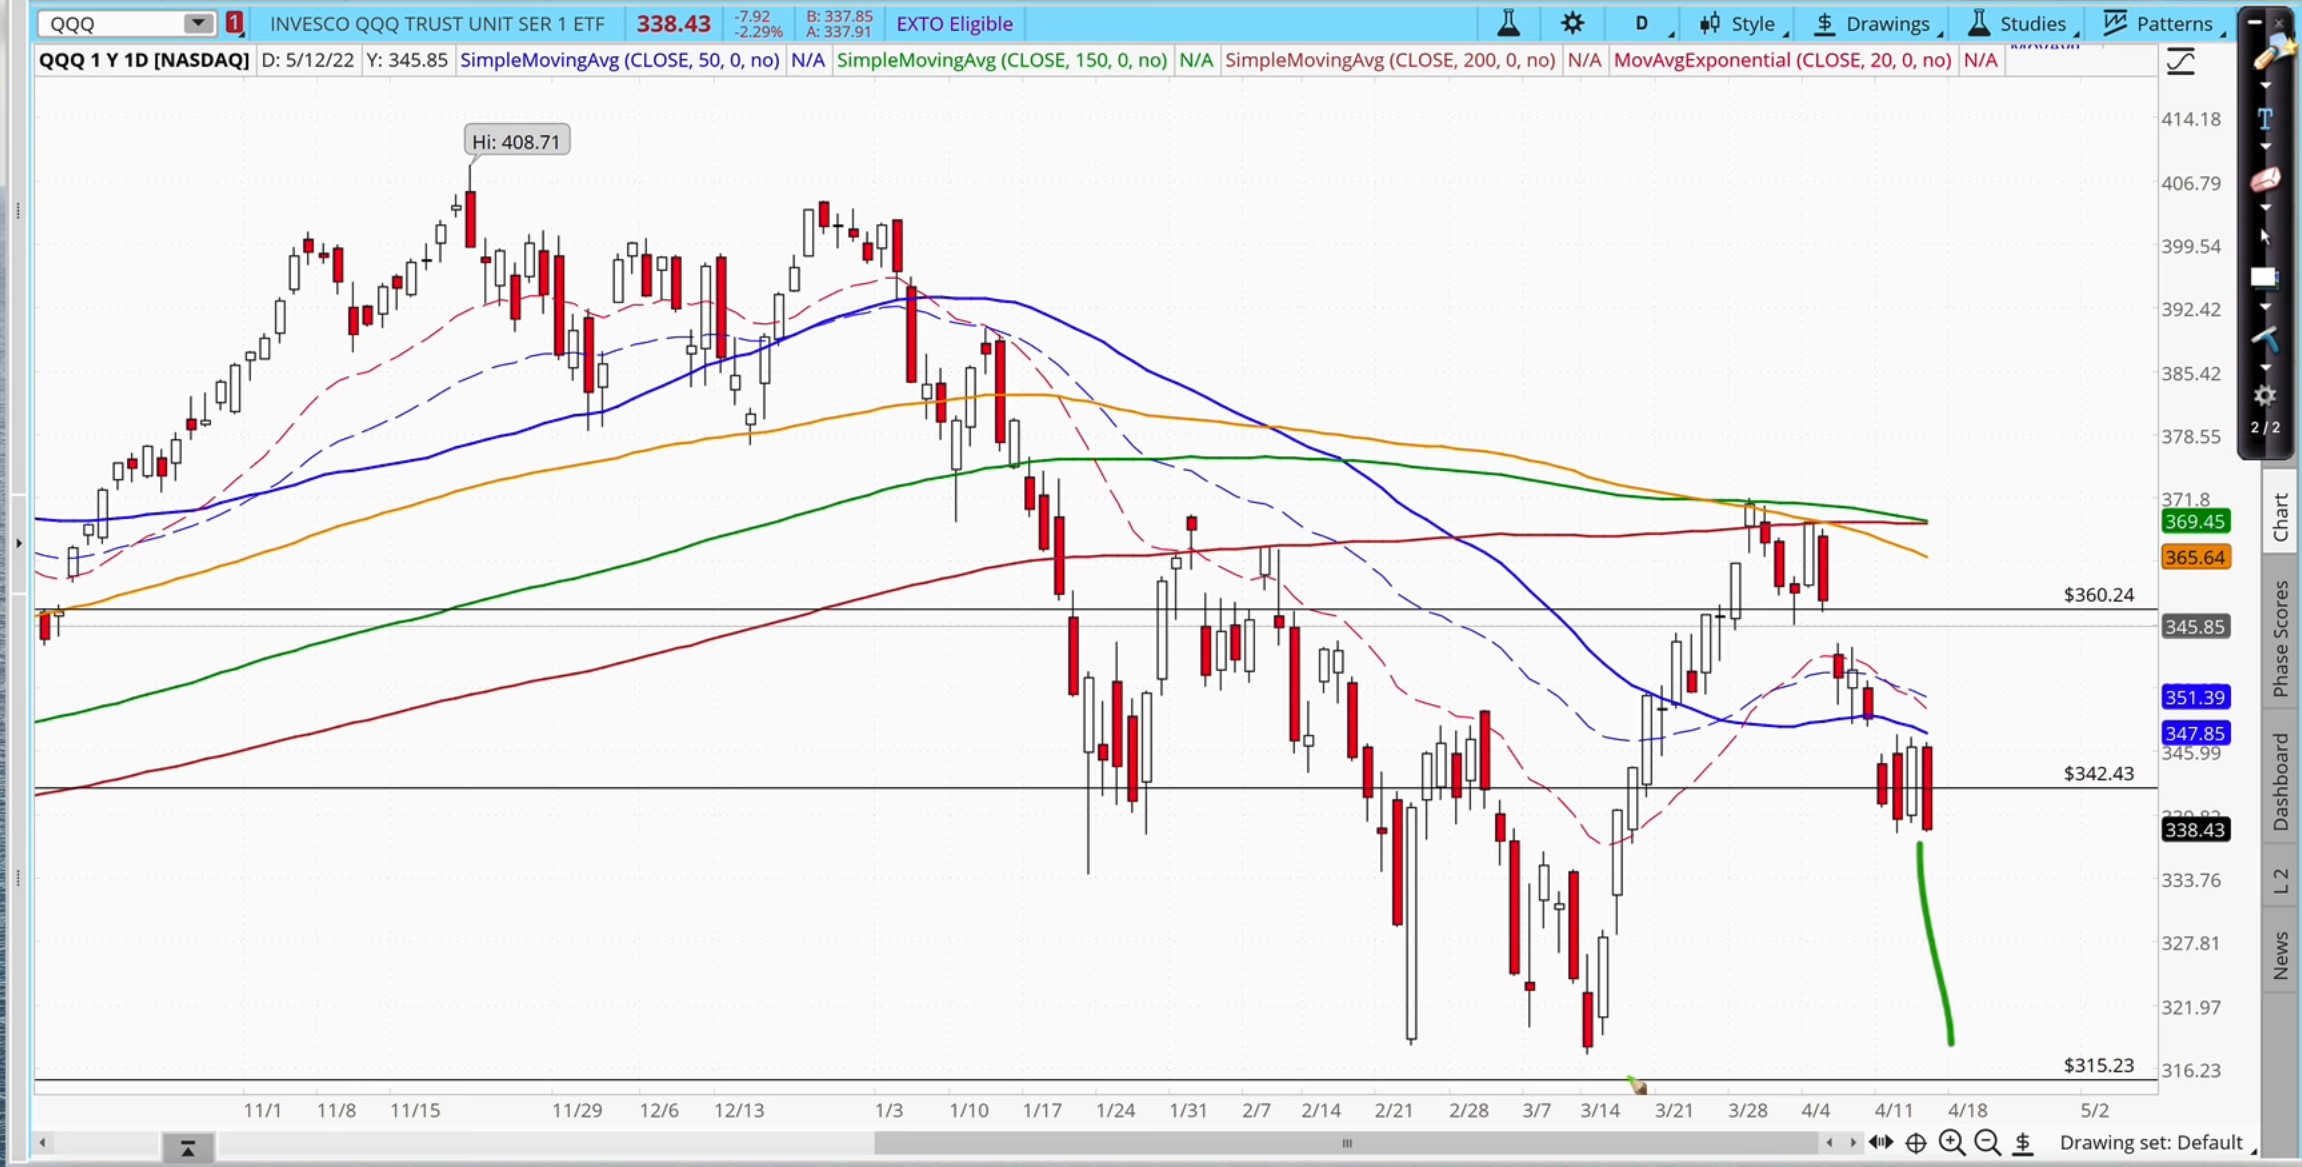
I have a few bearish options trades. I've been bearish on the QQQ which is the NASDAQ ETF for the short term. You can see the image above, I do have a small short position. I bought a bear put spread on the QQQ.
I'm also short on Alibaba (BABA).
Somebody said "What? You're shorting Alibaba? You bastard, you told us to buy!"
Okay, now hold on. I have Alibaba shares. I'm holding it because I believe it's going to double or triple in price eventually, but short term it may still go down. So I'm shorting BABA using options. I've made some money from there.
For example, these are my BABA trades:
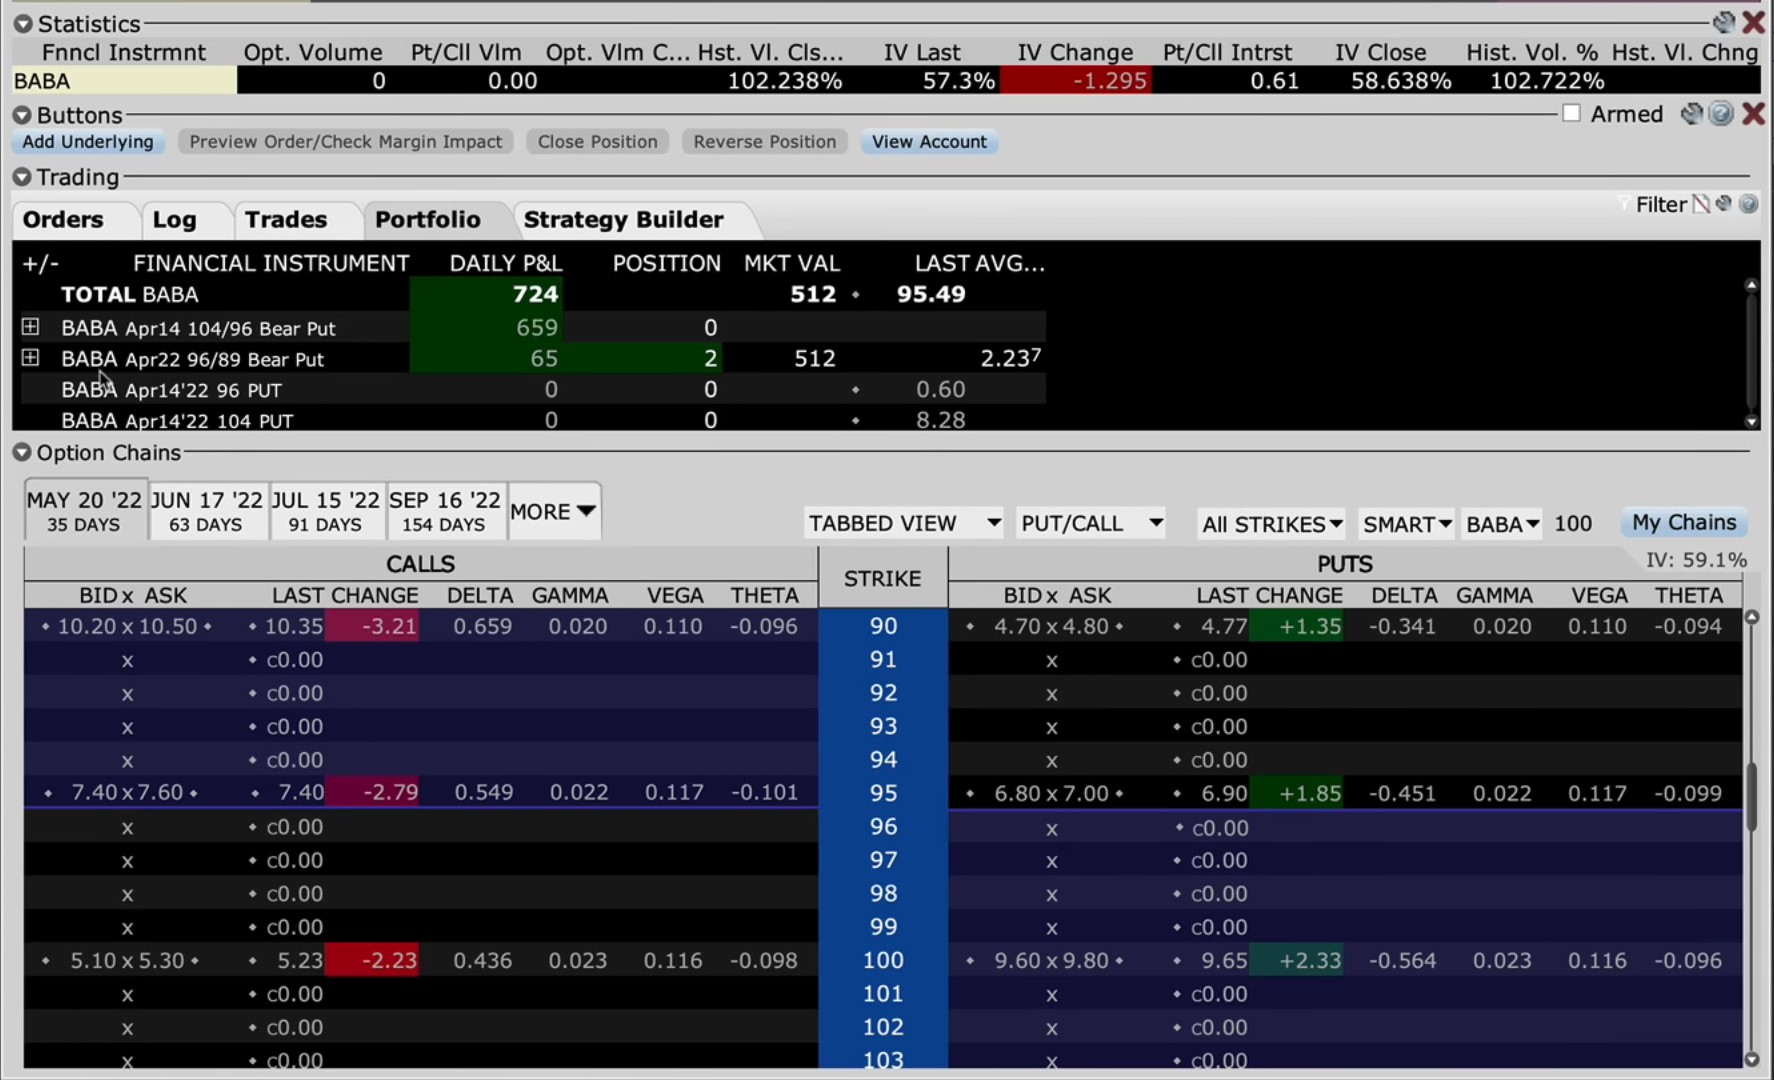
I just closed one right small profit. I also just opened another BABA bear put spread. So I've got a long-term investment position, but I do trade around that position sometimes, if there's a short-term downtrend. So that's how I manage my investments and my trades.
Now am I the only crazy guy who is seeing this as a buying opportunity?
NO!
Guess who else is buying stocks right now aggressively?
Corporate insiders!
Corporate insiders are people who are working in those companies — they are working in Facebook, they're in Apple, in Nvidia. They're working in all the companies, and they are buying shares aggressively with their own money. These are not shares that the company gives them. These are shares that they buy with their own cash that they have. These are not share buybacks, it's not the company buying back shares.
These are the actual DIRECTORS and STAFF who are buying shares on their own accord, and if you take a look at where we are right now, corporate insider buys are at a huge high.
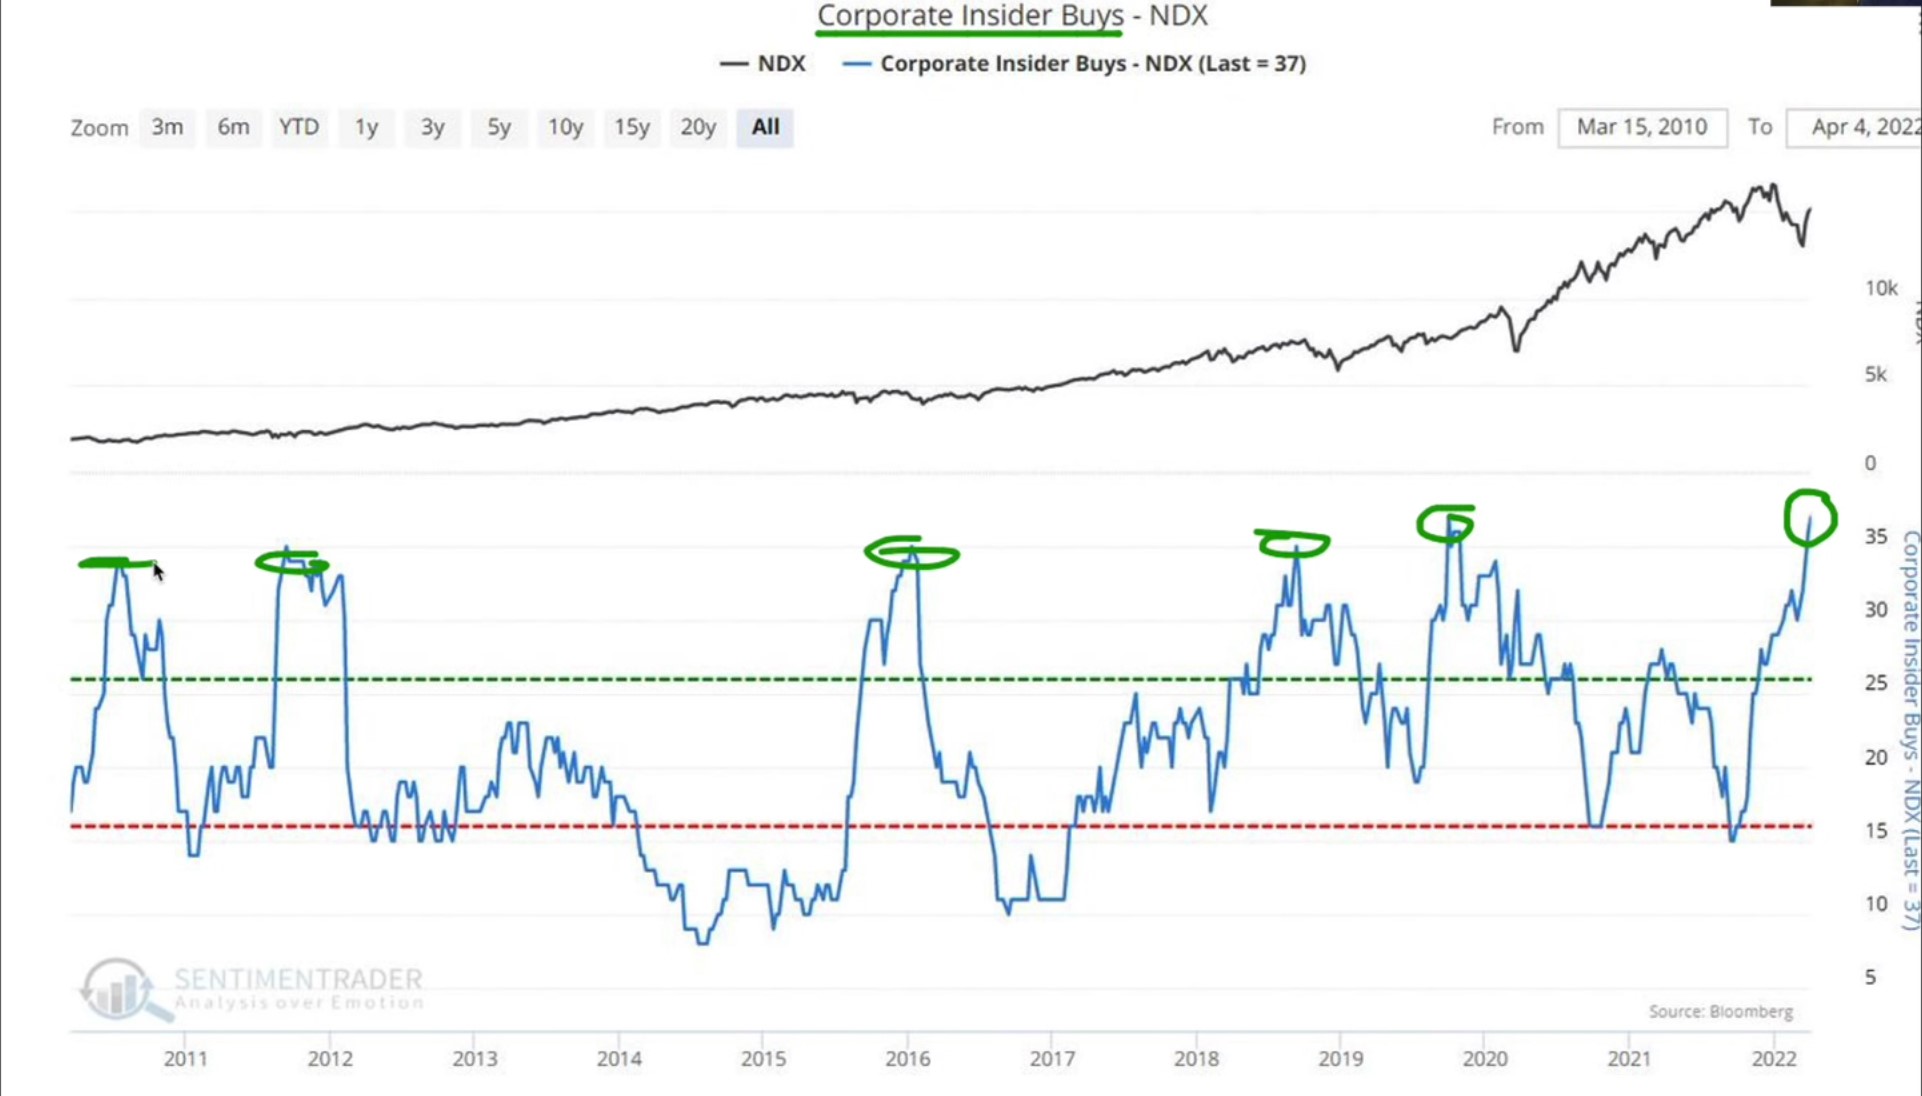
This doesn't happen that often, but every time you see a huge insider buying, it means that the insiders know that their companies are dirt cheap — that it's a great deal and that is when the market starts to take off as you can see historically.
Right now bullishness in a market is the lowest it's been in 30 years. Right now only 15% of retail investors are bullish, and the only time this has happened in the past was back in 1992.
So what happened in 1992? If you take a look at the history of the S&P 500, you can see that in 1992 we had 3 corrections over here:
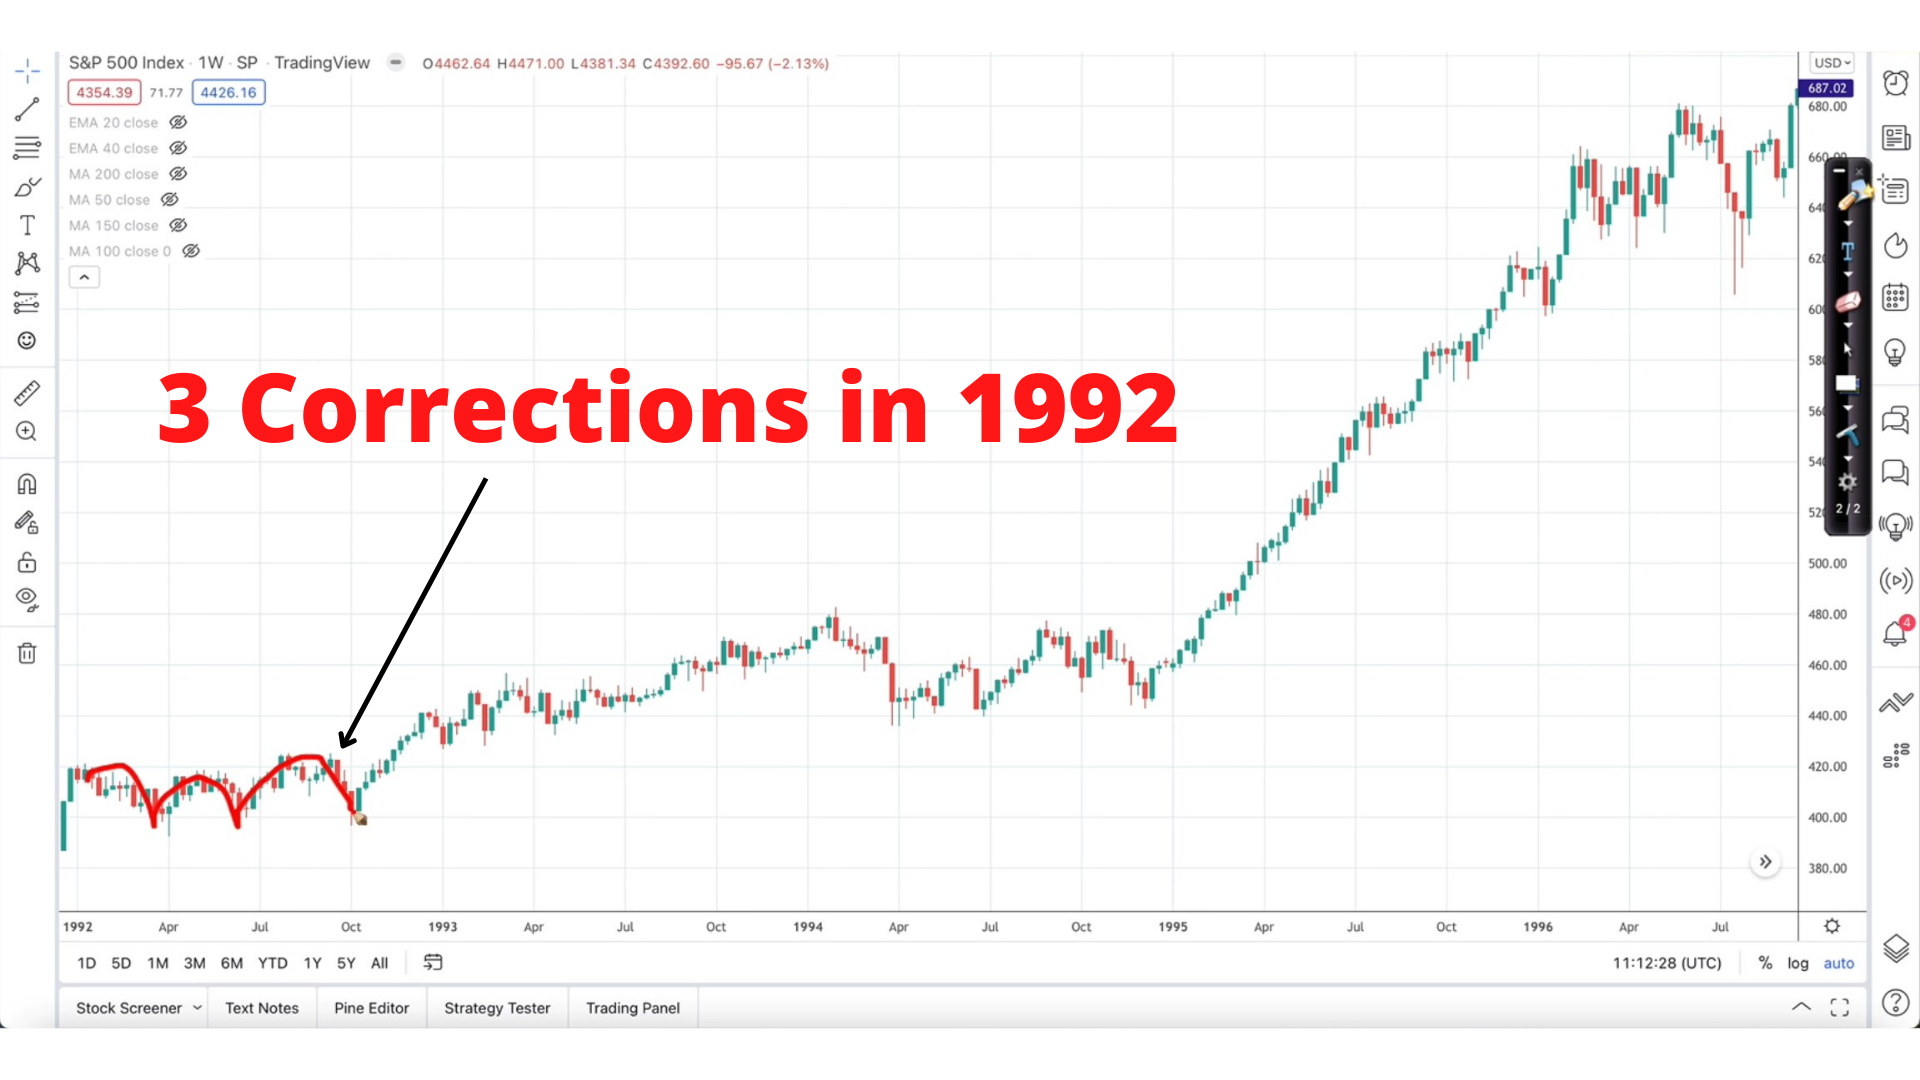
So people are getting fed up, the market is going nowhere and keeps going down. . . SELL!
And the moment they sell, BOOM! It goes up.
So it pays to be bullish when the majority are bearish. That's where the big money is made, and that's why Warren Buffett always says,
"The stock market is a device that transfers wealth from the impatient to the patient,"
So you've got to be patient and you've got to understand the businesses that you invest in.
If you invest in good businesses, no worries. They may go down in the short term, but they will always go higher. So use it as an opportunity to add more shares instead of being worried, frustrated, and panicking.
But of course, if you hold lousy companies that are losing money, then well that's another
story. Get rid of those and buy good companies instead!
Hope You've Learned Something
If you want to check out my online courses go to www.PiranhaProfits.com where you're going to learn how to invest & how to trade the financial markets and create an income from all around the world.
If you want to join my live Wealth Academy program, go on to www.WealthAcademyGlobal.com and find out more about how you can learn investing and trading live online.
Thanks for taking the time to read til the end. May the markets be with you!


submit your comment