Every few months, the media will come up with something new to scare the retail investors with, and of course, it's been Covid-19 for the last 2 years. Now recently their scare tactics involve rising inflation and rising interest rates, but sure enough, the market actually went up instead.
The media will always find something new to scare investors with. So what's new? What are they trying to put on people's minds right now?
"The Treasury Yield Curve has started inverting"
What's currently happening is that the 2-year Treasury yield has gone above the 10-year Treasury yield, creating what's known as a Yield Curve Inversion. What the media tells you is that it's the greatest predictor of a recession.
How true is this?
Does this signal an imminent recession and a bear market?
What should we do to prepare?
Table Of Contents
Is The Yield Curve a Reliable Indicator For Recessions?
It's Not a Good Timing Indicator. . .
You Don’t Have to Predict or Time the Markets to Beat It
Defensive Stocks to Protect Your Portfolio During a Recession/Bear Market
What's a Yield Curve?
The Treasury Yield Curve is basically a chart that shows you the different interest rates (also known as yields) that are paid by U.S. Government Bonds — known as treasury bonds — at different maturities.
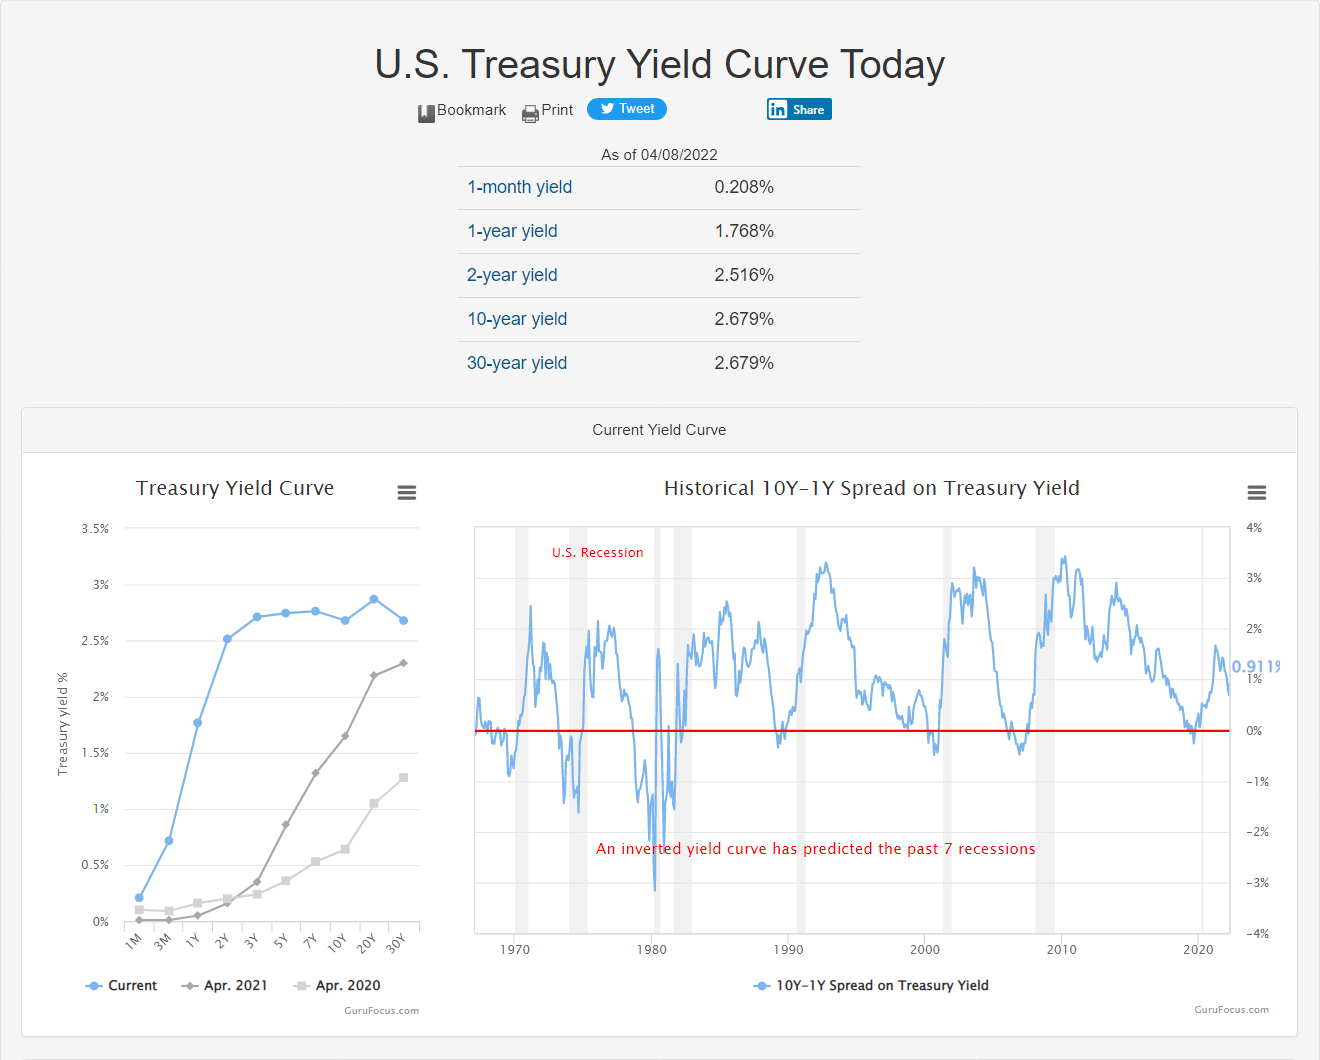
For example, if you buy a 2-year government bond, you'd get an interest rate of 2.516%. That means that if you lend money to the government for 2 years, they pay you 2.516% interest.
On a normal sloping yield curve, the longer you lend money, the more interest you'd get. But sometimes, something crazy happens, which is when the Treasury Yield % on the long-term bond falls.
For example, on the 10-year Treasury yield % falls to 2% but on the shorter-term bond like the 2-year, the Treasury yield % stays put or goes up. So when this happens, we've now got an inverted yield curve.
It simply means that the longer-term bonds pay less interest than the shorter-term bonds. This usually is a sign that people expect bad times or a recession.
Bond prices move in the opposite of bond yields. So when bond prices go up, the bond yields go down, and vice-versa. So when you see the long-term yield going down and causing the inversion, it's because long-term bonds are going up. They go up when people fear a recession so they sell stocks, which they think are risky, and they buy safe-haven bonds.
When everyone is buying the long-term 10-year & 20-year bonds, what happens?
The bond price goes up, and the bond yield comes down. So when the longer-term yield goes lower than the shorter-term yield, you've got a yield curve inversion. This is why it's known as a predictor of a coming recession because people are buying long-term bonds to prepare for the recession. Generally, we would look at the 10-year vs the 2-year yield.
Is The Yield Curve a Reliable Indicator For Recessions?
In the last 30 years, the 10-year treasury yield has fallen below the 2-year yield (negative spread) 8 times. In 6 out of the 8 times, a recession and bear market followed.
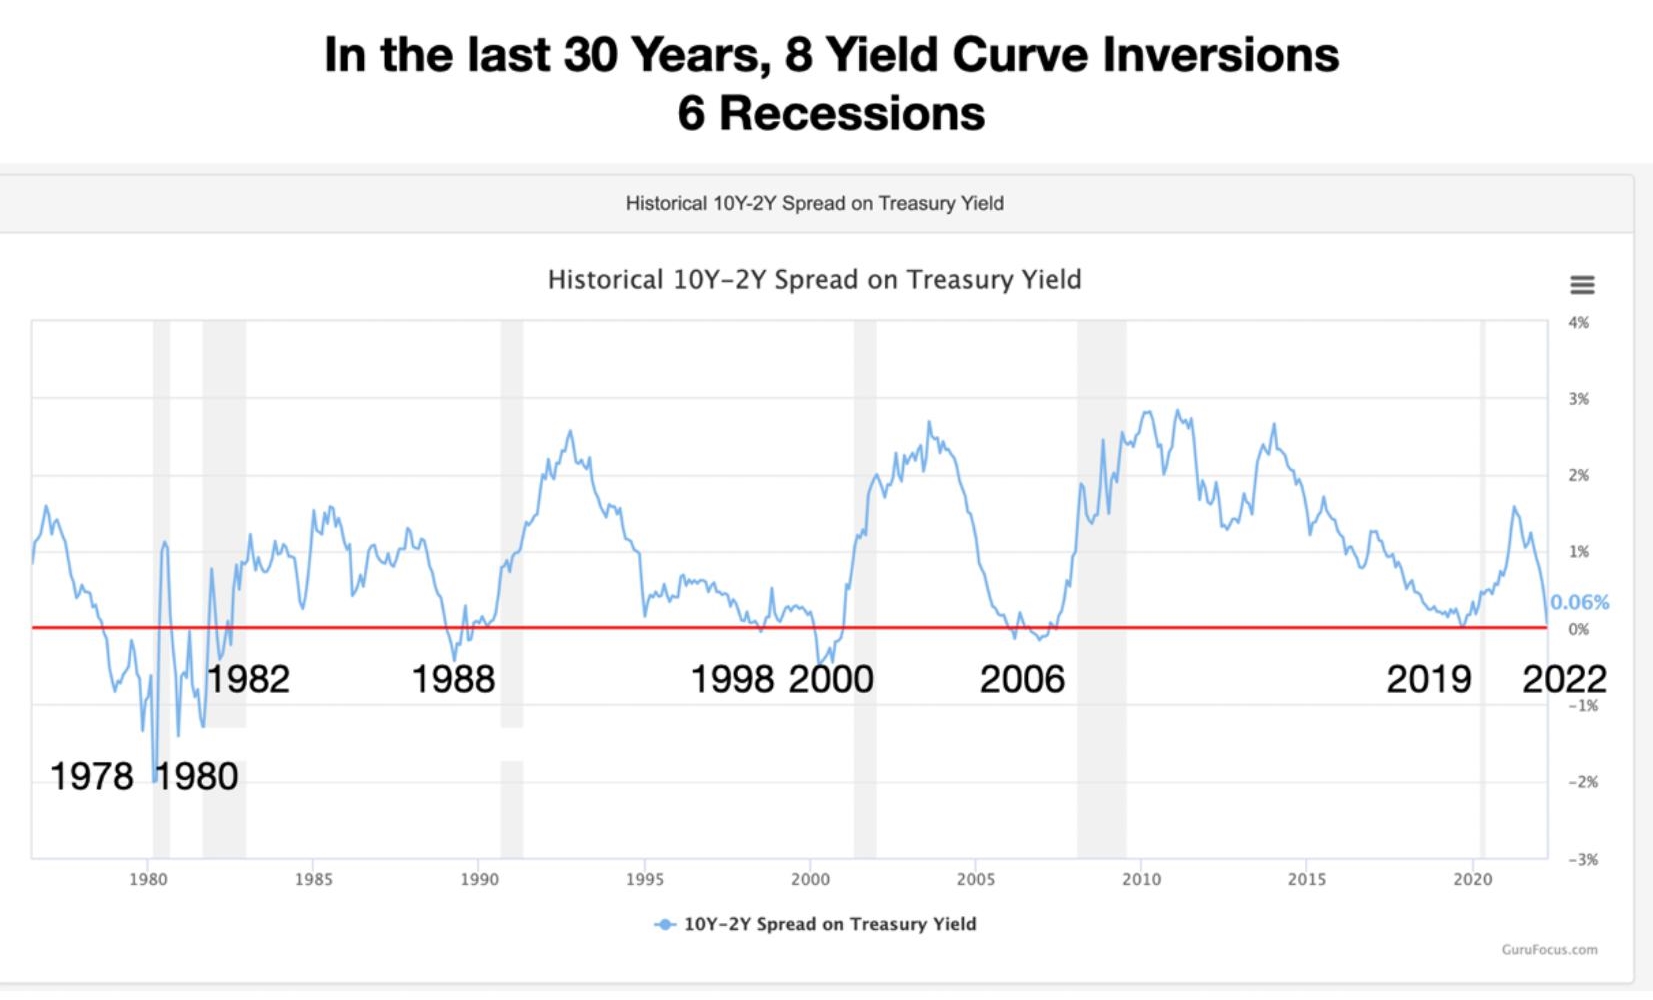
Some investors are freaking out because this negative spread is happening for the first time in 3 years. In my latest Youtube video, I explain that I do not see a strong recession signal just yet.
Firstly, for this indicator to be reliable, the 10-year yield needs to STAY BELOW the 2-year yield for an extended period of time (at least 1 quarter). So far, the negative spread has only happened sporadically over the last week or two. We need to see a more sustained inversion to call a coming recession.
Secondly, previous inversions have been accompanied by the 10-year treasury yield declining. Remember that treasury bond yields move opposite of Bond prices. When people sell bonds, prices fall and yields rise. When people buy bonds, prices rise and yields fall.
When long-term (10, 20-year) bonds prices rise and yields fall, it’s an indication that the market is anticipating a coming recession. This is because bonds are seen as a safe haven. When people expect lower economic growth ahead, they sell equities and buy long-term bonds to seek shelter.
This is why rising long-term bond prices (falling yields) are a predictor of a coming recession.
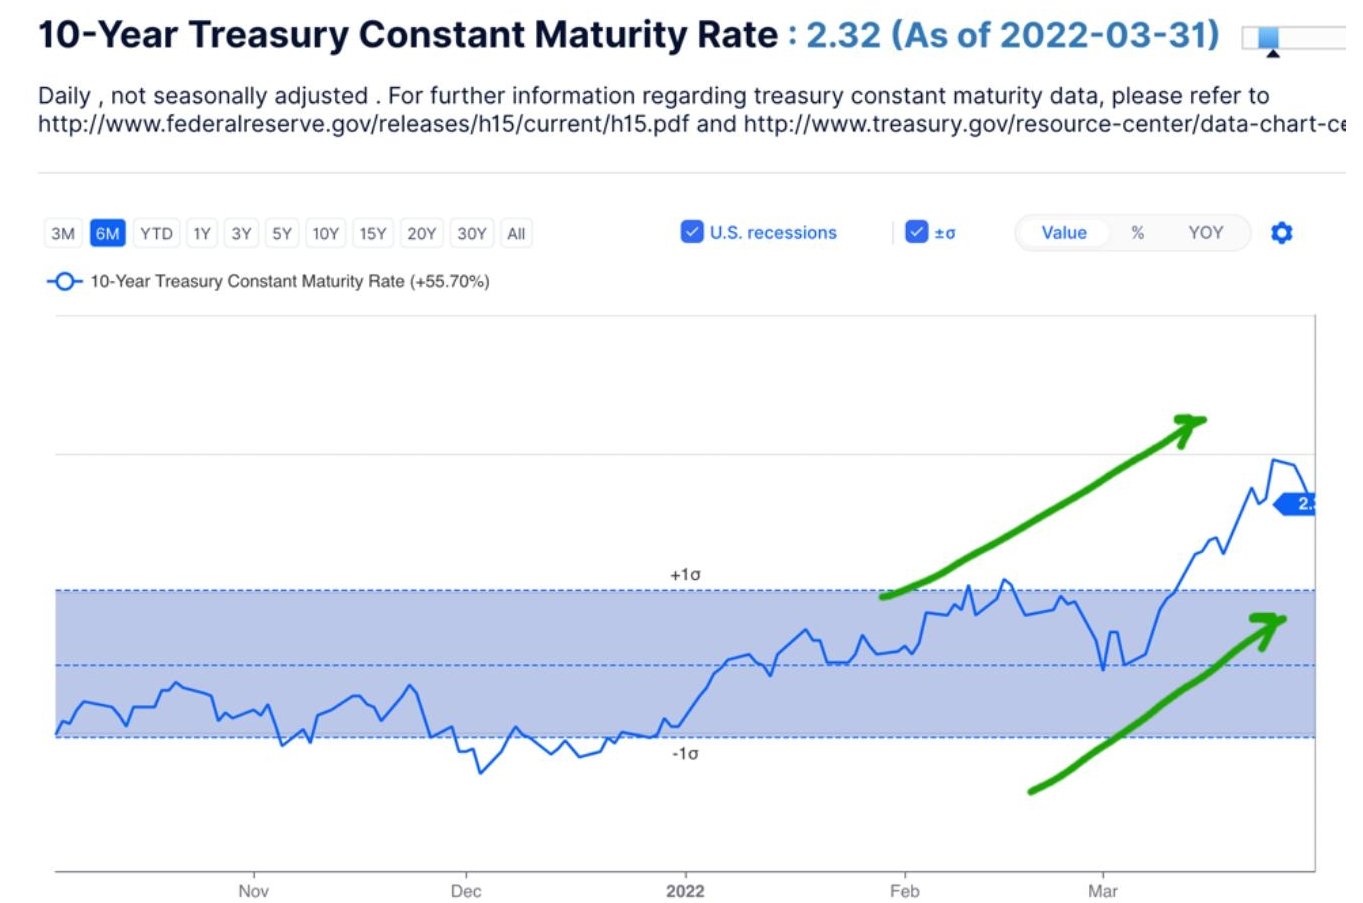
However, this is not happening now. Currently, long-term bond prices are still falling (look at the TLT 20-year bond ETF) and the 10-year yield is rising (see chart above). A rising 10-year yield means that the market still sees economic growth (and inflation) in the future. A rising 10-year yield is a proxy for economic growth.
It's Not a Good Timing Indicator. . .
Even if the Yield curve stays inverted and reliably predicts a coming recession, it cannot tell us when the recession will start, nor can it tell us when the market will peak before declining into a bear market.
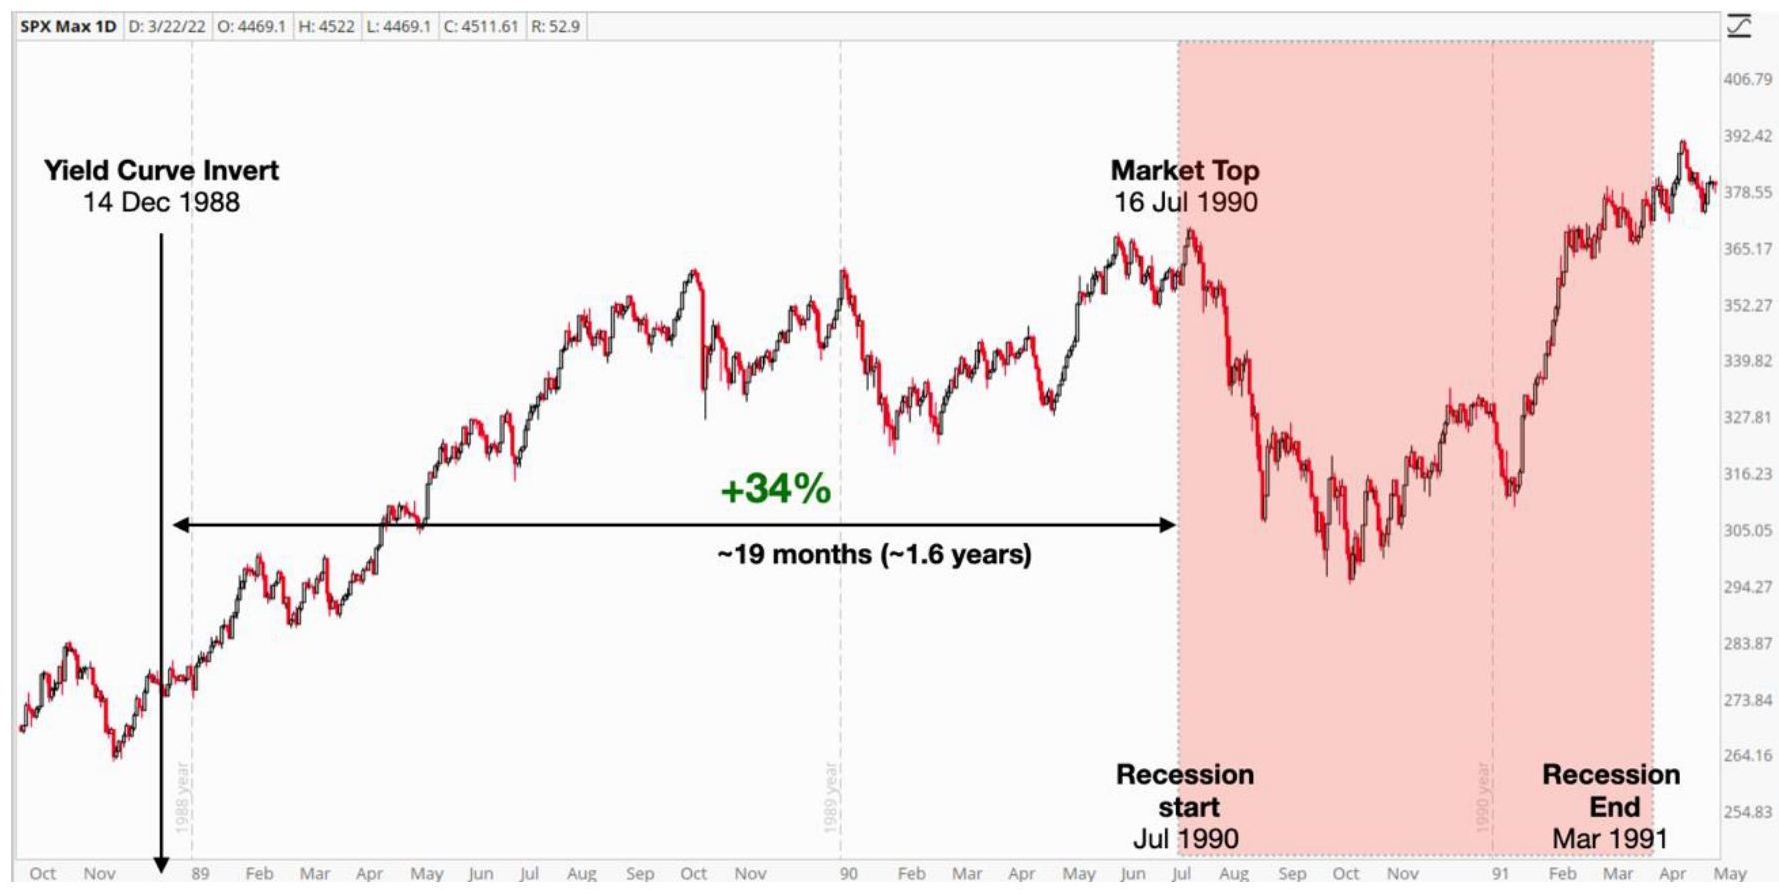
Look at the table below. You can see that the lag time from yield curve inversion to the market top can vary widely… from 5 months to as long as 1.7 years. Investors who get out of the market after a yield curve inversion could miss out on additional gains of up to +34% before the recession and bear market actually starts.
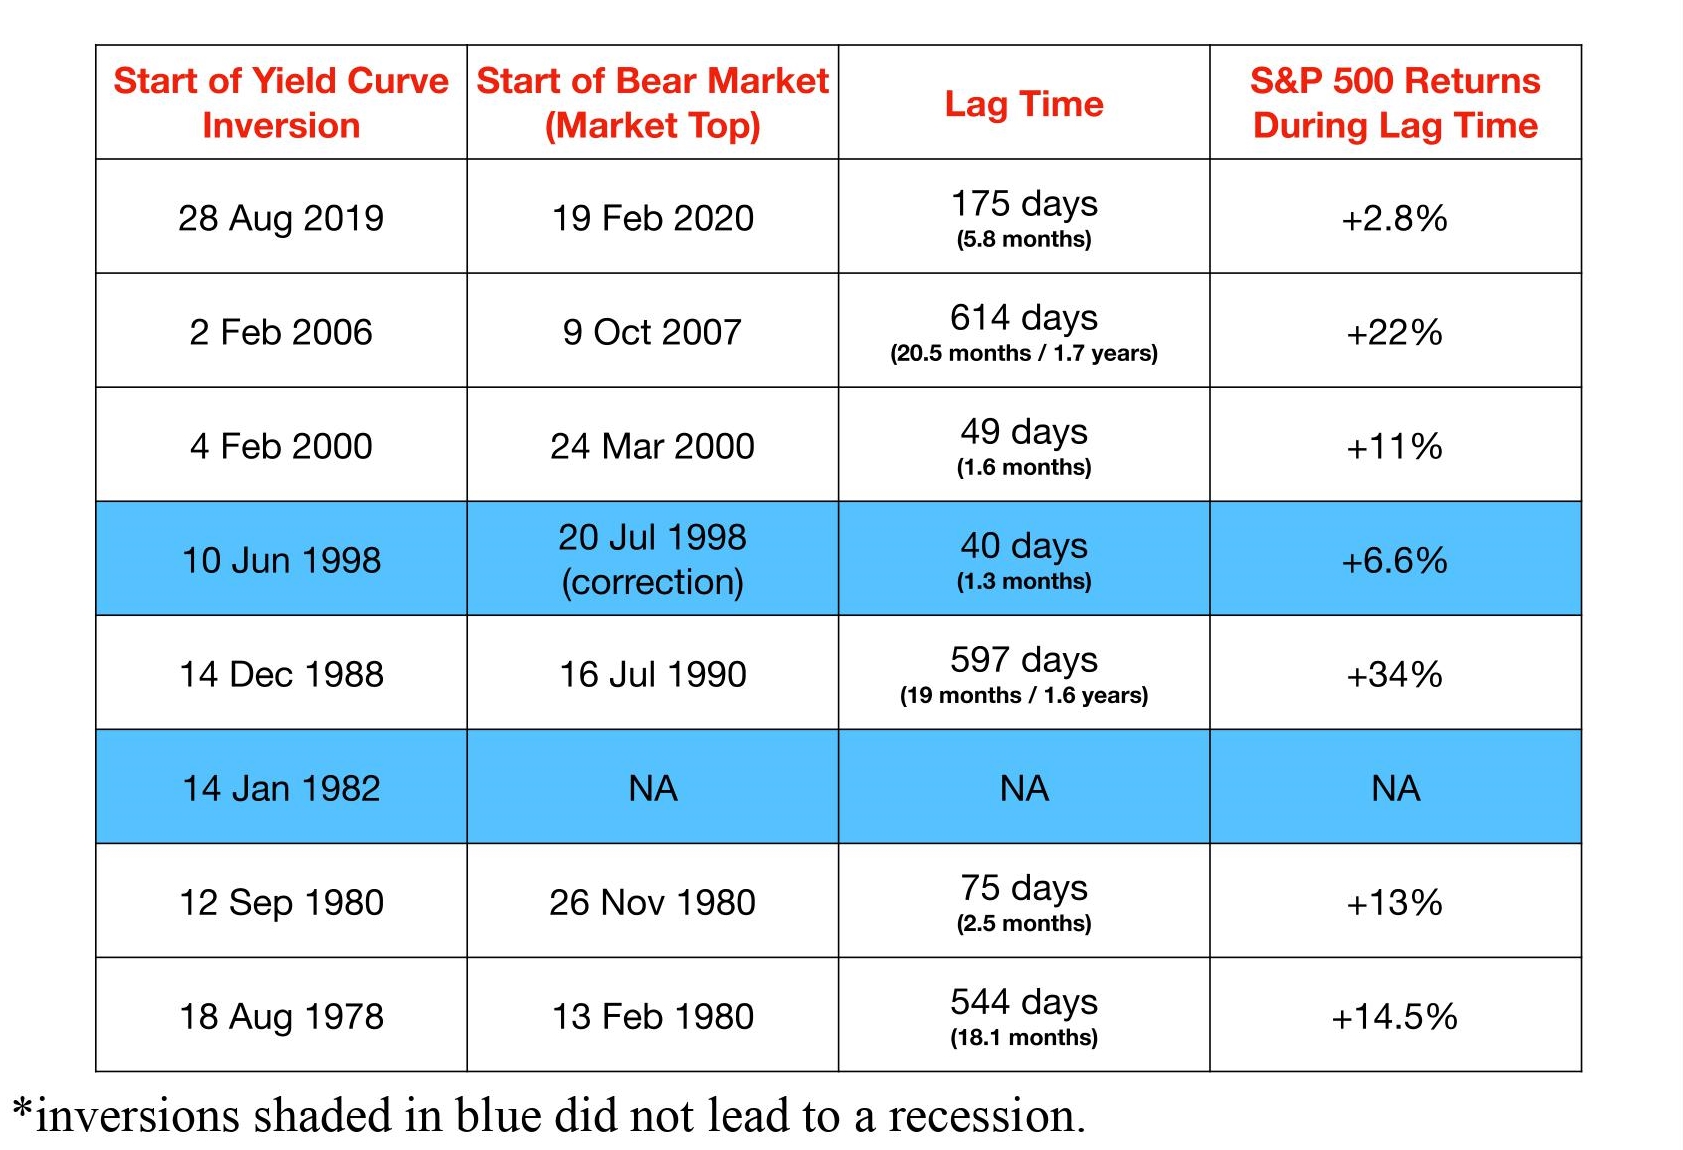
For example, when the yield curve inverted in Dec 1988, the recession started and the market only topped 1.6 years later in July 1990. Investors who sold based on this recession predictor would have missed out on a lot more gains. They would have been better off just holding on.
My Investing Plan
As an investor, I will not simply sell my stocks just because an economic indicator predicted a coming recession.
I would only sell my stocks if the underlying business fundamentals have changed or if prices have become insanely overpriced. As long as I believe that more and more people will continue to eat KFC, Taco Bell, and Pizza hut, I will keep holding Yum Brands (YUM).
As long as I know that more and more people will search and advertise on Google and watch Youtube, I will continue to hold into Alphabet (GOOGL).
You get the idea!
We can never predict exactly when the market will start to decline into a correction/bear market and exactly when it’s going to bottom. It sounds like a great idea to be able to sell the tops and buy back the bottoms.
In reality, trying to jump in and out of the markets often leads to underperformance over the
long run.
Investors often jump out too early (and the market continues going up for an extended period of time) or jump out too late (the market is already nearing the bottom and ready to reverse back up).
They then jump back in too late and end up getting back in at much higher prices or never being able to get back in at all (the market leaves without them).
You Don’t Have to Predict or Time the Markets to Beat It
The great news is that we can beat the market and generate double-digit returns over the long run without having to time entries and exits perfectly. We just need to hold a well-diversified portfolio of fundamentally good businesses that generates returns (high ROE, high ROIC, high profit margins) above the majority of average companies.
This outperformance can only come from businesses that have sustainable competitive advantages (wide economic moats) to maintain pricing power and ward off competition. This is why it is important to only invest in stocks that pass the strict 7-step Value Momentum investing criteria that you have learned in the Whale Investor™ course or Wealth Academy™ Masterclass.
So, how do we minimize the volatility and inevitable drawdowns in our portfolio during recessions/bear markets (that will come eventually)?
How do we take advantage of bear markets instead of fearing them?
The first key is to ensure that your portfolio has enough defensive stocks that would rise during a bear market or move down only slightly. This way, your defensive stocks will buffer and defend the short-term declines of your more cyclical, speculative, or growth stocks. I will highlight some of the more defensive stocks in the next section.
The second key is to always have the cash to invest regularly in the markets. Investing is not a sprint, but a marathon. One of the secrets of successful investing begins with how you manage your money. Financially successful people always live below their means. They spend less than they earn and invest their savings regularly into the market, quarter after quarter, year after year.
Investing regularly and adding slowly in tranches ensures that you are able to dollar cost average down during corrections and bear markets. Doing so always guarantees that you lower your purchase cost per share over time.
Defensive Stocks to Protect Your Portfolio During a Recession/Bear Market

Defensive stocks may not grow as aggressively as high-growth stocks, but they are important to reduce your portfolio’s volatility during a bear market. What percentage of your portfolio you choose to allocate to defensive stocks depends on how conservative you are.
As with all types of stocks, you want to slowly add shares of defensive stocks when they get undervalued and when their price action retraces down to the support level. You don’t buy them at the last minute when the bear market starts (they may be too expensive to buy by then).
Defensive stocks are companies that sell a product or a service that is usually a necessity and their sales and profits are not dependent on the economic cycle. Most defensive stocks tend to come from sectors like healthcare, consumer staples, and Utilities.
If you look at the last 3 recessions, you can see how defensive stocks go down much less (or even rise up) during a bear market.
SPX versus Defensive Stocks (2000-2001)
During the dot com crash of 2000-2001, the SPX declined 50%, but stocks like WMT, JNJ, CL, PEP, PG, and TLT (20-year bond ETF) bucked the downtrend.
.jpg?width=1876&name=SPX%20vs%20Defensive%20Stocks%20(2000-2001).jpg)
SPX versus Defensive Stocks (2008-2009)
During the Financial crisis of 2008-2009, the SPX declined over 50%, but stocks like WMT,
MCD, AMZN, and TLT (20-year bond ETF) bucked the downtrend the most.
.jpg?width=1887&name=SPX%20versus%20Defensive%20Stocks%20(2008-2009).jpg)
SPX versus Defensive Stocks (2020)
During the Covid crash of 2020, the SPX declined over 36%, but stocks like WMT, COST, DG, AMZN, and TLT (20-year bond ETF) bucked the downtrend the most. CLX was an exceptional stock because it provided cleaning/disinfectant unique to the pandemic. The restaurants like MCD, YUM which are usually defensive did not fare well in this particular recession for obvious reasons (people could not visit the restaurant)
.jpg?width=1636&name=SPX%20versus%20Defensive%20Stocks%20(2020).jpg)
The cause of every recession is different. However, the most defensive stocks have consistently been Walmart (WMT), Amazon (AMZN), Dollar General (DG), Johnson and Johnson( JNJ), and the 20-Year Treasury Bond ETF (TLT.)
I still believe that there's a bullish momentum in the US stocks, so let's see if they can carry through to the rest of the year.
Stay safe everyone, and may the markets be with you!
Keen on learning how to invest safely in the best stocks at the right time? Take a look at my WHALE INVESTOR™ Course. It will equip you with a complete investing skillset — Stock Market Basics, Fundamental & Technical Analysis, and Trading Psychology.


submit your comment