In April 2025, the VIX hit roughly 65. That was one of the sharpest single-event spikes in the index's history triggered by Liberation Day tariff announcements that sent markets into a brief but violent tailspin.
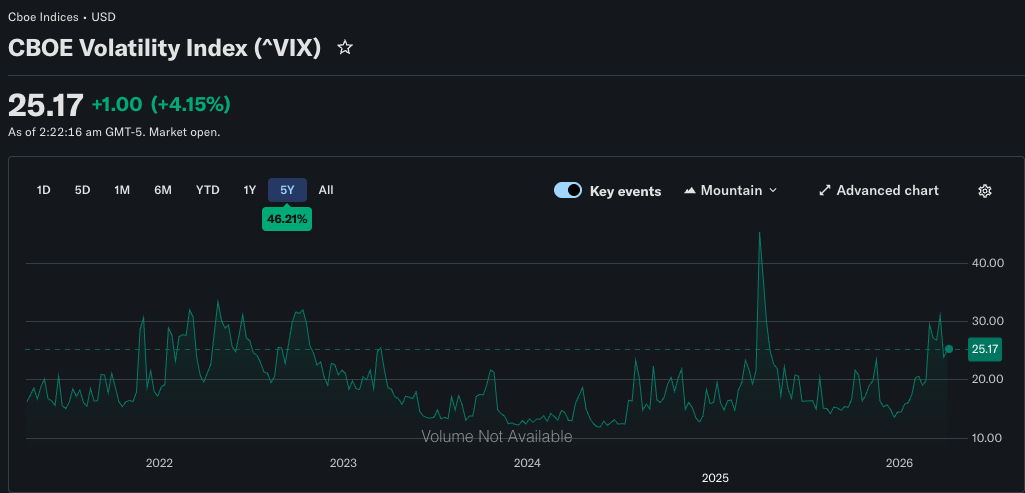
As of early April 2026, the VIX sits at around 25. The VVIX (a measure we will get to shortly) is hovering near 130. Oil markets are still absorbing the shock of geopolitical tensions in the Middle East, and the residual tariff uncertainty from 2025 has never fully left the picture.
Most investors would look at that 24 reading and reach for the same conclusion: the market is a bit fearful. The fear gauge is elevated. Watch out. That reading is not wrong. But it is incomplete.
The VIX at a single point in time tells you less than most people think.
What the VIX Actually Measures (And Three Things Most People Get Wrong)
So here’s how we would explain VIX to the layman.
Think of the VIX as a poll, but instead of asking people what they think, it reads what they are actually paying for.
Every day, thousands of S&P 500 options contracts are trading across the market. Some are bets that the market will fall sharply. Others are betting it stays stable. The prices on all of those contracts, taken together, reflect what traders are collectively willing to pay to hedge against different outcomes. The more they are paying, the more uncertainty is being priced in.
The CBOE takes that entire landscape of options, from deep in-the-money to far out-of-the-money and uses a formula to extract a single number from all of those prices. That number represents the level of volatility the market is collectively implying over the next 30 days.
The 30-day part requires a small technical fix. Options expire on fixed calendar dates, not every 30 days. So on any given day, the two closest expiration dates will be somewhere between 23 and 37 days out. The CBOE blends the prices from both expirations to produce a reading that always represents a consistent, constant 30-day window.
So when you see the VIX at 24, what you are reading is: based on what the entire options market is currently paying, traders are collectively implying that the S&P 500 could move roughly 24% annualised (or about 6.9% in either direction) over the next 30 days.
And here are the three common things most investors get wrong about the VIX.
First: it is implied volatility, not expected volatility. These two things sound similar but behave differently. Implied volatility is what the options market is pricing in. Expected volatility is a forecast based on historical data and models.
Second: you cannot actually buy or trade the VIX itself. The index itself is not a tradeable instrument. What investors access is a range of derivatives built on top of it: VIX futures, VIX options (which are priced off the futures, not the spot index), and exchange-traded products like VXX and UVXY that track rolling VIX futures positions.
Third: the VIX is not a put-options index. It uses both call and put options across many strike prices. In practice, puts demand dominates during fear spikes because that is where hedging demand concentrates. But the methodology is broader, which is why the VIX also rises ahead of major uncertainty events; Fed meetings, elections, geopolitical escalations for example.
The Futures Curve: What the VIX Alone Cannot Tell You
VIX futures are monthly contracts that settle to the expected value of the VIX at a future date. The relationship between these contracts (how their prices change as you move from near-term to longer-dated) is called the term structure. It typically takes one of two shapes.
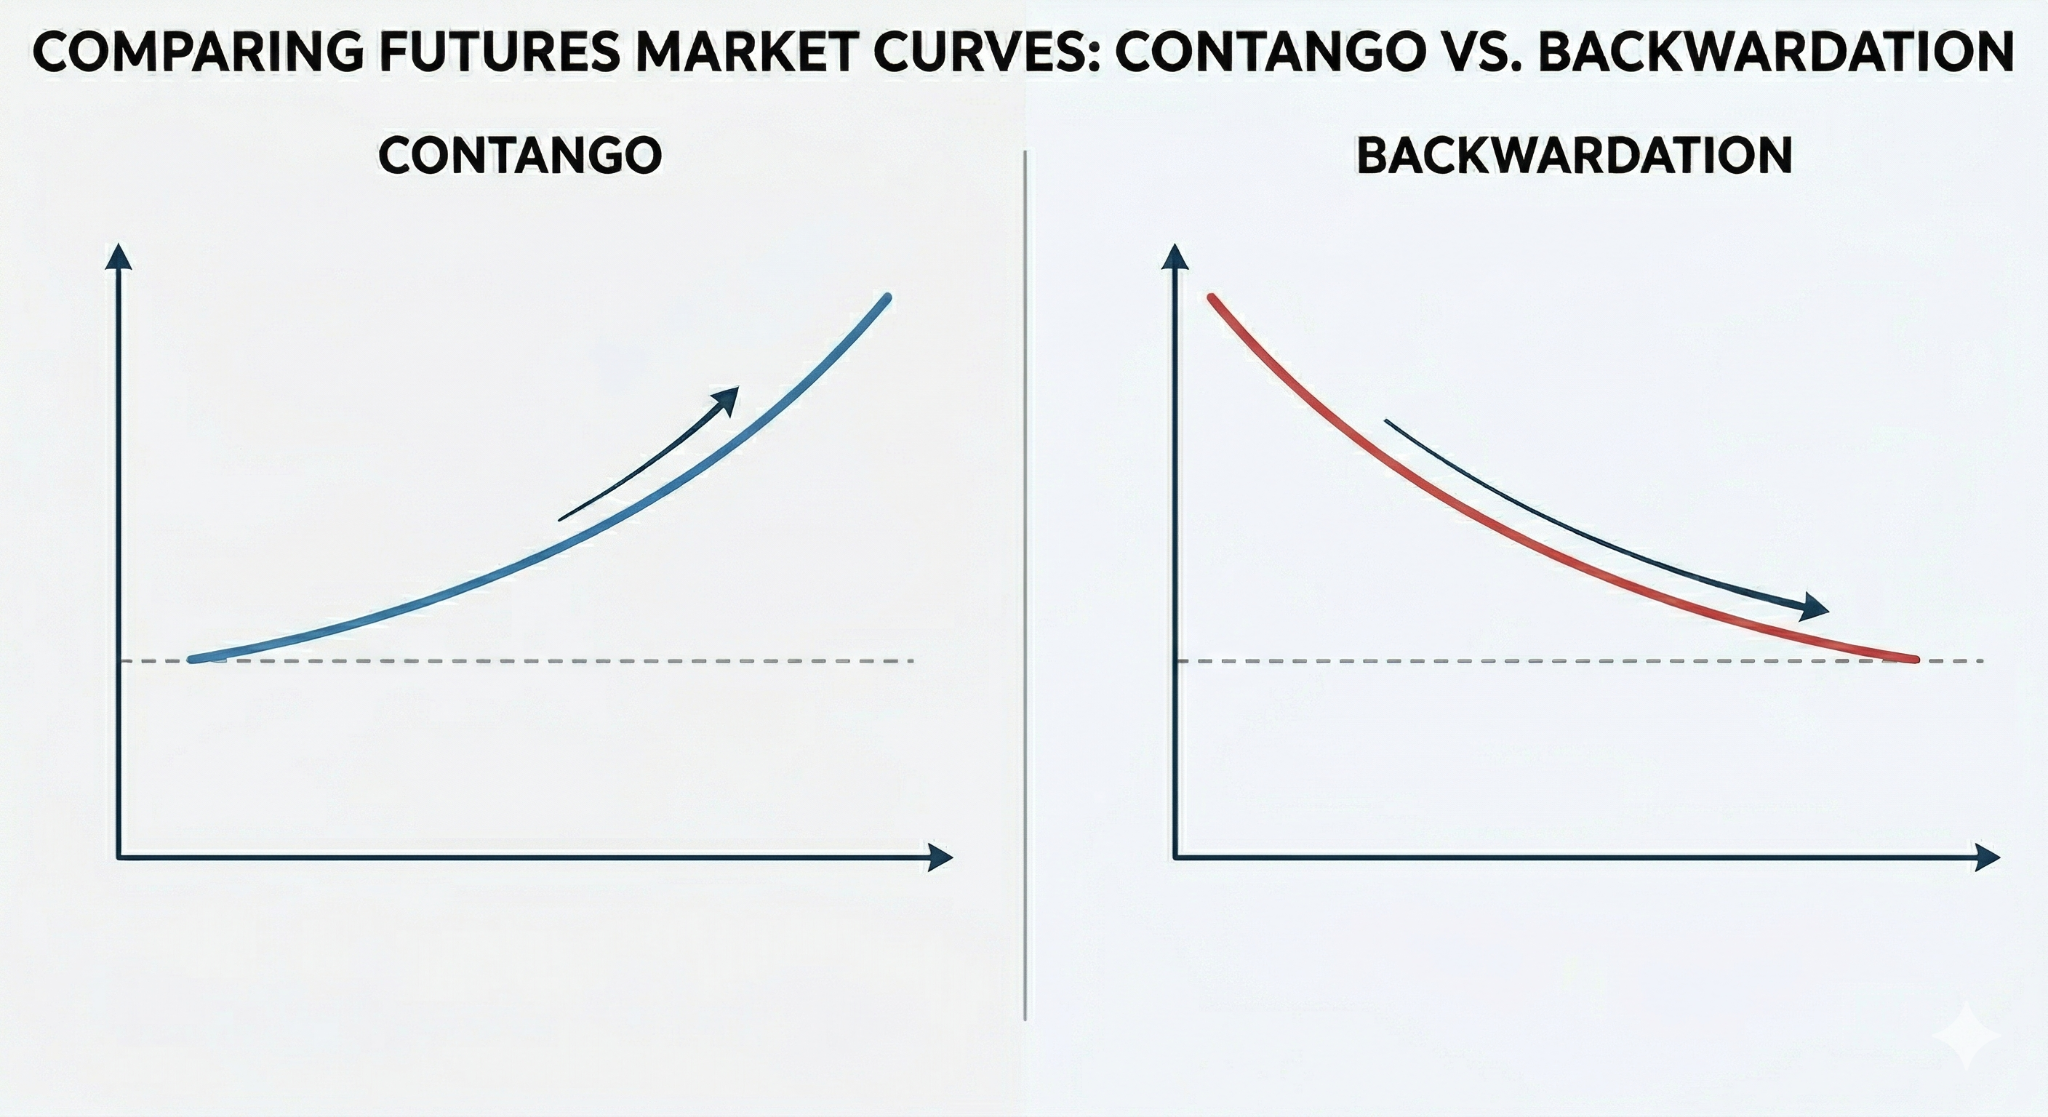
Contango is the normal state. It occurs when longer-dated VIX futures are priced higher than near-term ones, producing an upward-sloping curve. The interpretation is intuitive: there is more uncertainty about what happens six months from now than what happens next week, so investors pay a premium to hedge further out.
Historically, the VIX futures curve has been in contango approximately 84% of the time since VIX futures launched in 2004. The average daily contango between the front and second-month contracts runs around 5-6%.
Backwardation is the exception. It occurs when near-term futures are priced higher than longer-dated ones, producing a downward-sloping curve. This happens when immediate fear dominates the cost of short-term protection spikes because investors are scrambling for it right now.
It has occurred less than 20% of the time since 2010, and the episodes that produced it are a recognisable list: the 2008 financial crisis, the 2011 European debt crisis, the Q4 2018 selloff, March 2020, Liberation Day 2025.
The practical implication most retail investors miss: roll yield decay.
If you have ever held VXX or UVXY for more than a few weeks and wondered why they kept bleeding even in choppy markets, the answer is in the contango structure. These products track rolling VIX futures positions. They continuously sell expiring near-term contracts and buy the next month's contracts. In a contango environment, that means selling cheaper and buying more expensive. Over time, this roll yield creates a drag that erodes value regardless of whether the VIX moves.
VXX and UVXY are instruments built for short-term tactical hedging around specific events, not long-term portfolio insurance.
The Variance Risk Premium: Why Options Buyers Are Almost Always Overpaying
The variance risk premium (VRP) refers to the persistent tendency of implied volatility to exceed the volatility that actually materialises in the market. In plain terms: options are almost always more expensive than the realised risk they are insuring against.
Think of the options market as a home insurance market. An insurer pricing policies in a neighbourhood where 10 houses burn down each year might price premiums as if 20 houses will burn. The overpricing is intentional, it reflects the insurers’ need to build in a profit margin against catastrophic risk. Options sellers are playing the role of the insurer. Options buyers are the homeowners, systematically paying more than the actuarial fair value of the protection they are receiving.
The options seller's payoff profile reflects this: small, consistent gains in the roughly 85% of periods where implied vol exceeds realised vol, interrupted by catastrophic losses in the rare moments when realised vol explodes beyond what was priced.
The premium exists because someone has to bear that tail risk, and bearing it rationally demands compensation.
What does this mean for you as an investor right now?
With the VIX sitting at roughly 24 (above its long-run average of approximately 19) you will be buying options protection into above-average implied volatility.
VVIX: The VIX of VIX
If the VIX is the market's heartbeat, the VVIX is its blood pressure.
The CBOE VVIX Index (introduced in 2012 and sometimes called the VIX of the VIX) is calculated using the same methodology as the VIX, but with VIX options as inputs rather than S&P 500 options. It measures the expected volatility of the VIX itself over the next 30 days. The VIX tells you how fearful the market is. The VVIX tells you how uncertain the market is about its own fear level.
Its long-run average sits in the 85-95 range.
Most of the time, VIX and VVIX move together. When markets sell off, both rise. But the more interesting signal is when they decouple. When the VVIX rises sharply while the VIX stays flat or moves only modestly, it typically indicates that sophisticated market participants are pre-positioning for a volatility event before it materialises.
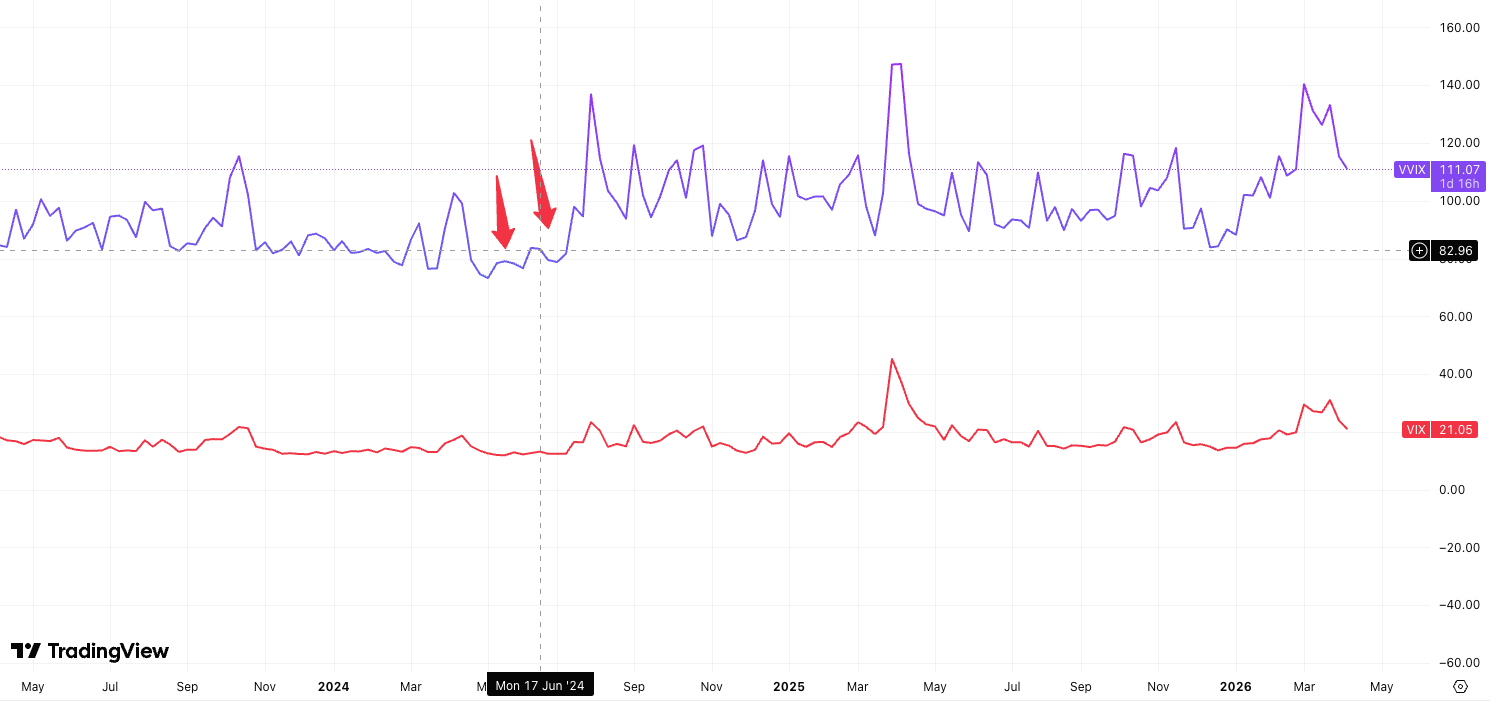
In the language of Charles Schwab's research: a rising VVIX against a flat VIX "is one of the more reliable early-warning signals in the options market." It reflects real options order flow from participants who are positioning for a tail event.
How to Use Volatility in Investing / Trading
Most investors treat the VIX as literal as low means safe, high means danger. By now you can see why that framing undersells the real use of the VIX index.
When the VIX is low and the futures curve is in steep contango, the market is calm and complacency is being priced in. This is historically where the cost of buying protection is cheapest and where the eventual shock tends to be most underpriced.
When the VIX spikes and the futures curve moves toward backwardation, acute fear is dominant. Near-term protection becomes expensive because everyone is reaching for it at the same time. Historical data suggests that sustained backwardation has tended to mark peak panic rather than the beginning of a prolonged crisis.
When the VVIX is elevated relative to the VIX, institutional participants are pre-positioning for a volatility event before it materialises. And at extreme VVIX readings, historical data suggests the market is often closer to peak anxiety than to the beginning of a sustained vol expansion.
If you hold VXX or UVXY as a long-term hedge, understand that the contango structure is working against you every day the VIX does not spike. These instruments are built for short-duration tactical hedging around specific events, not as permanent portfolio insurance.
Volatility is not an obstacle to navigate around. Learning to read it properly does not tell you what the market is going to do. But it tells you a great deal about what the market believes, what it fears, and what it is currently paying for that fear.


submit your comment