So last week on the 22nd & 23rd of May I said that there was a high chance the market was due for a rally — due for a bounce. I said that the market was extremely oversold, and the market's like a rubber band or like a pendulum. Once it gets oversold, it tends to snap back up.
Table Of Contents:
Is This The Market Bottom Of The Year?
Key Resistance Levels I'm Looking At
- Definition Of A Bear Market
- Company Earnings Would Have To Decline
- GDP Is Still Projected to Grow
- Fundamental Shift In The Macro Picture
Recap Of My Last Video
So last week I said that if you take a look at the S&P 500 and the NASDAQ, they were way oversold. For example, if you take a look below at the QQQ — the NASDAQ ETF, I said it has dropped so much that the Williams %R is in oversold territory, and this is on the weekly candles and this doesn't happen that often.
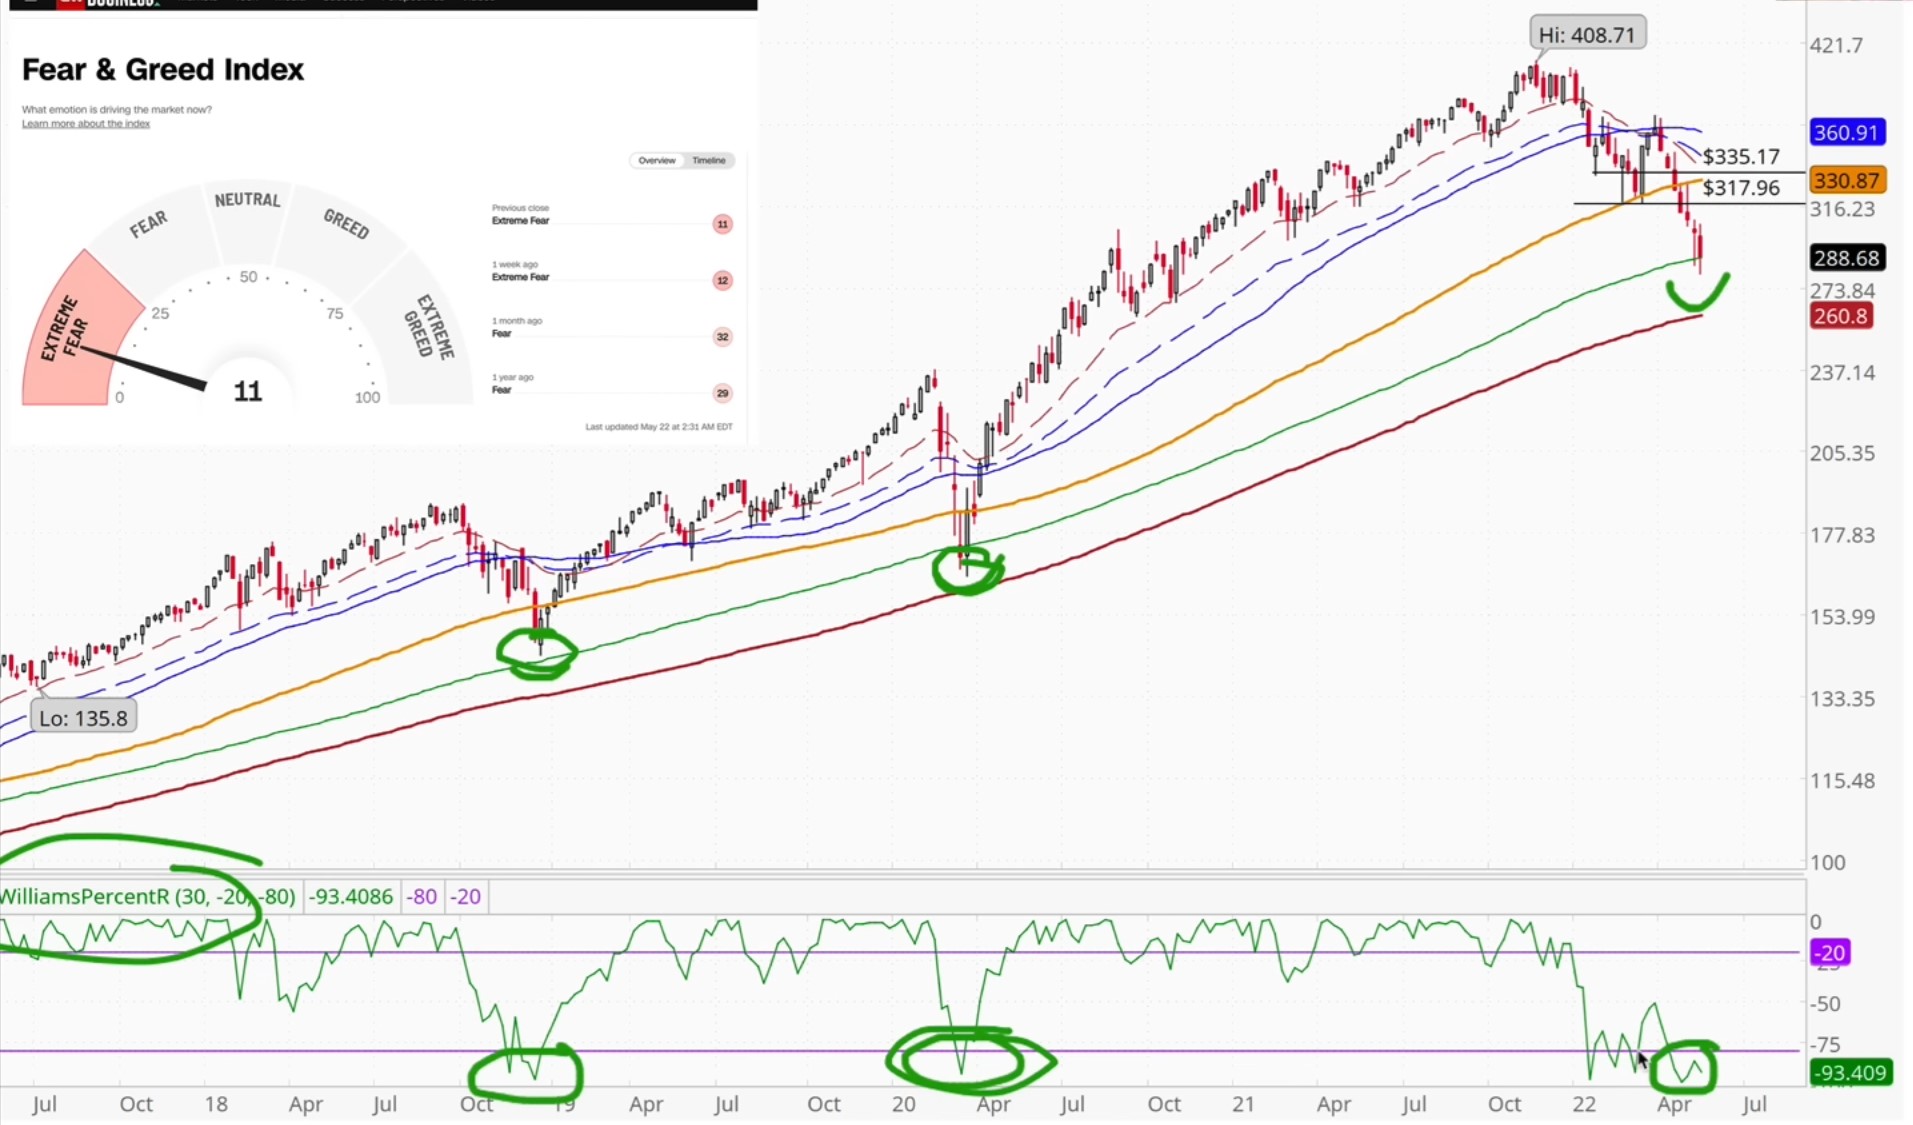
It happened at the bottom of the Covid crash, it happened at the bottom of the 2018 correction as well, and now it's appearing again. So it tells you that the market on a long-term basis is extremely oversold and due for a bounce. At the same time, I said that the last two times the NASDAQ went down, it bounced off that 150 moving average (the green line) and it's testing that level right now.
So there's a high chance it's gonna bounce back up.
I also mentioned in my video that for the very first time I saw a divergence between the S&P 500 going down and the Advance/Decline line that was actually going up. It's the first time that it's happened in a long time, so I talked about the S&P making continually lower lows, and generally, the Advance/Decline line makes lower lows as well.
This means that there are more decliners than advances — more stocks are going down than there are stocks going up. But for the first time, we saw the S&P making a lower low while the Advance/Decline line makes a higher low, so there's a divergence.
🧠 So that means that the market looks like it's going down but there are actually more stocks going up than going down within the S&P.
That's a very interesting thing that just happened and I said that these are signs that the market is beginning to show signs of a reversal.
Is This The Market Bottom Of The Year?
Surely enough, we got that bounce we were waiting for. We got that strong reversal rally, and you can see that last week, we ended with a very bullish candlestick pattern. After seven red candles in a row, we had one big white candle appear.
So this is a very very powerful bullish signal. This is a sign that the market has bottomed. . . at least for now.
So for the next couple of days at least, I expect the market to continue going up. I'm very bullish on the short term which I've mentioned the last time, you can take some short-term bullish trades in the market.
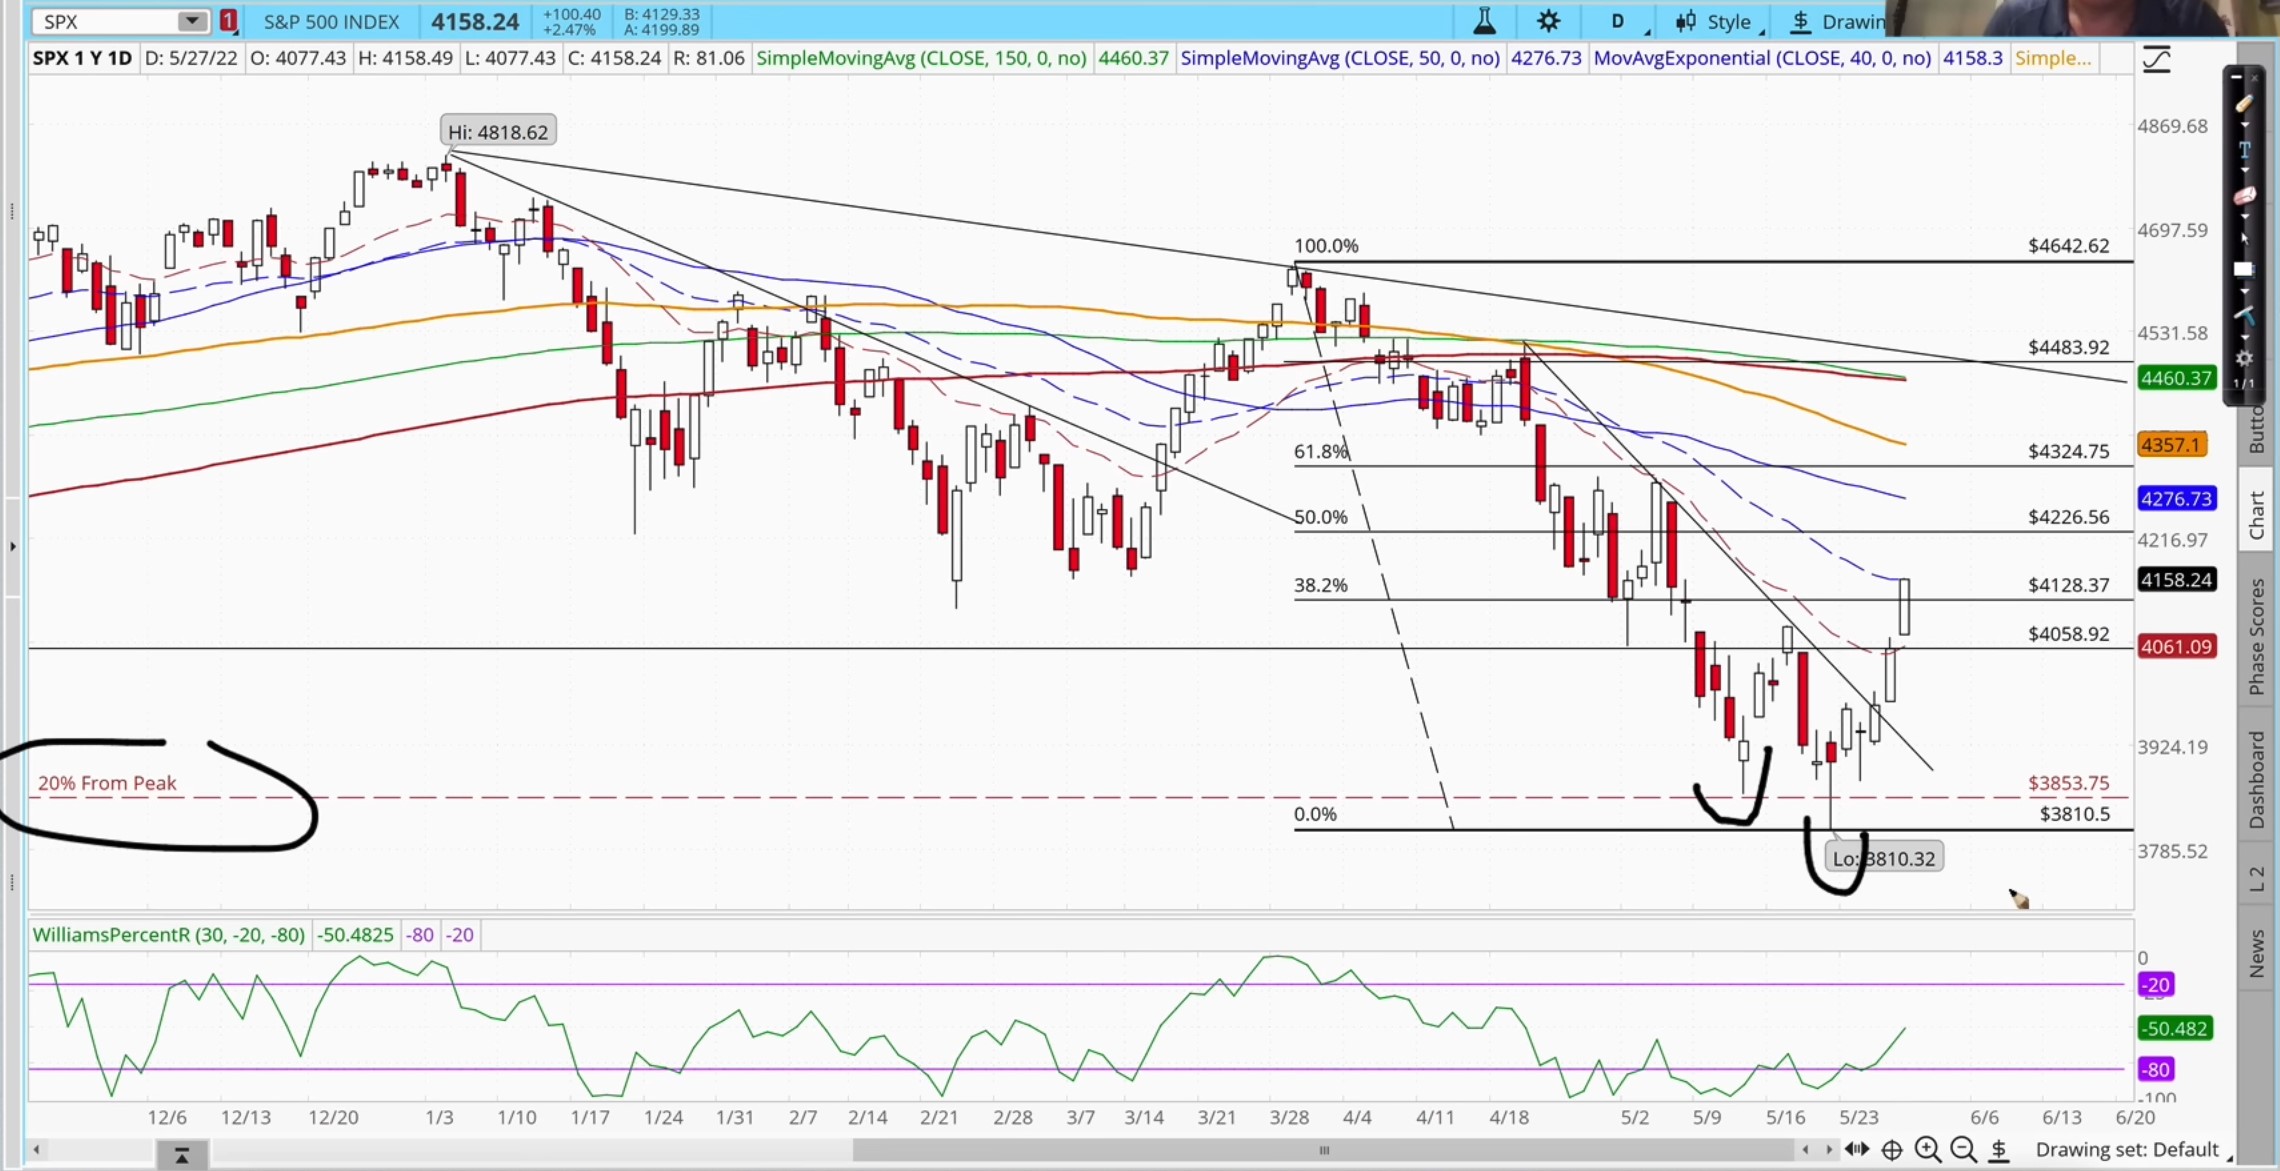
Now let's zoom down and take a look at the daily candles.
So on the daily candles, you can see that we bottomed recently, and I mentioned in my last video that this is known as a classic 'BEAR TRAP' where the market goes down and people think that we're in a bear market, and they all go short, and the next thing the market does is it reverses back up and traps all the bears.
The market goes up and the bears get killed — we call it a bear trap.
That signals the bottom of this correction. So since then, we've had 5 days of very bullish action and we have broken above the most recent short-term resistance level. That's why we are short-term very bullish right now.
I actually called the market bottom a few times if you recall.
I said "Hey this could be the bottom," a few times, and the market went up and reversed back down again each time. You can see on the chart that earlier on, the market broke above the previous resistance, and then it similarly came back down
again.
🧠 Here's the point: I can tell you when the market is going to reverse. It's very simple — just look at the candlestick patterns and look at oversold levels. What I CAN'T tell you is how long this rally will last. I can't see beyond a certain point. I can tell you that it's going up, but will it continue? I can't see that because there are too many variables in play that I can't predict.
For example, I can't predict the earnings of companies. I can't predict whether the 10-year yield is going to continue going down or going up (I'll talk about that in a while) but for now, we are bullish.
We are going up, but the question is, is this the bottom of the year?
Are we going to go to all-time highs, or is this a dead cat bounce again?
Are we just setting up for another leg down?
If you listen to most comments on social media, and you listen to most people on the financial news and on YouTube, the majority of people believe that this is a dead cat bounce, that this is a bear market rally.
What does that mean?
That means the majority of people believe don't trust this rally. What they're saying is that it's going to wave up and hit a certain level, and then go all the way down even lower!
Is this possible? Could this be the start of an even bigger bear market?
I don't know, and here's the interesting thing that I've learned over the last 30 years of being in the markets:
When everyone when most people expect something, it doesn't happen.
That's just the way the market is and when everyone expects a recession — when everyone expects a big bear market — sometimes it doesn't happen because the market likes to go opposite of what the majority think. It's just the way it is.
In fact, there's an old saying that says "The market tends to move in a way that hurts as many people as possible."
That's why if most people think that it's a bear market rarely and most people get ready to go short, the market tends to fake everyone out, goes the opposite direction, and hurt as many people as possible.
So for me, I'm keeping an open mind.
I believe that anything can happen depending on the data that we get, whether companies continue to report earnings that grow or decline. But for now, my base case is that I don't see this as a bear market rally, I don't see it until I get a piece of new or different evidence — and I'll explain why in a short while.

subscribe to our newsletter today!
Get first dibs on our latest investing & trading content every week FOR FREE!
*Your email address will not be forwarded to any third party. We respect your privacy.
Key Resistance Levels I'm Looking At
So what's happening right now is I'm looking at the market and saying "Okay short term we are going up, we're really
bullish right, however, we're going to face some resistance that could turn it back down."
So what are the levels that I'm looking at?
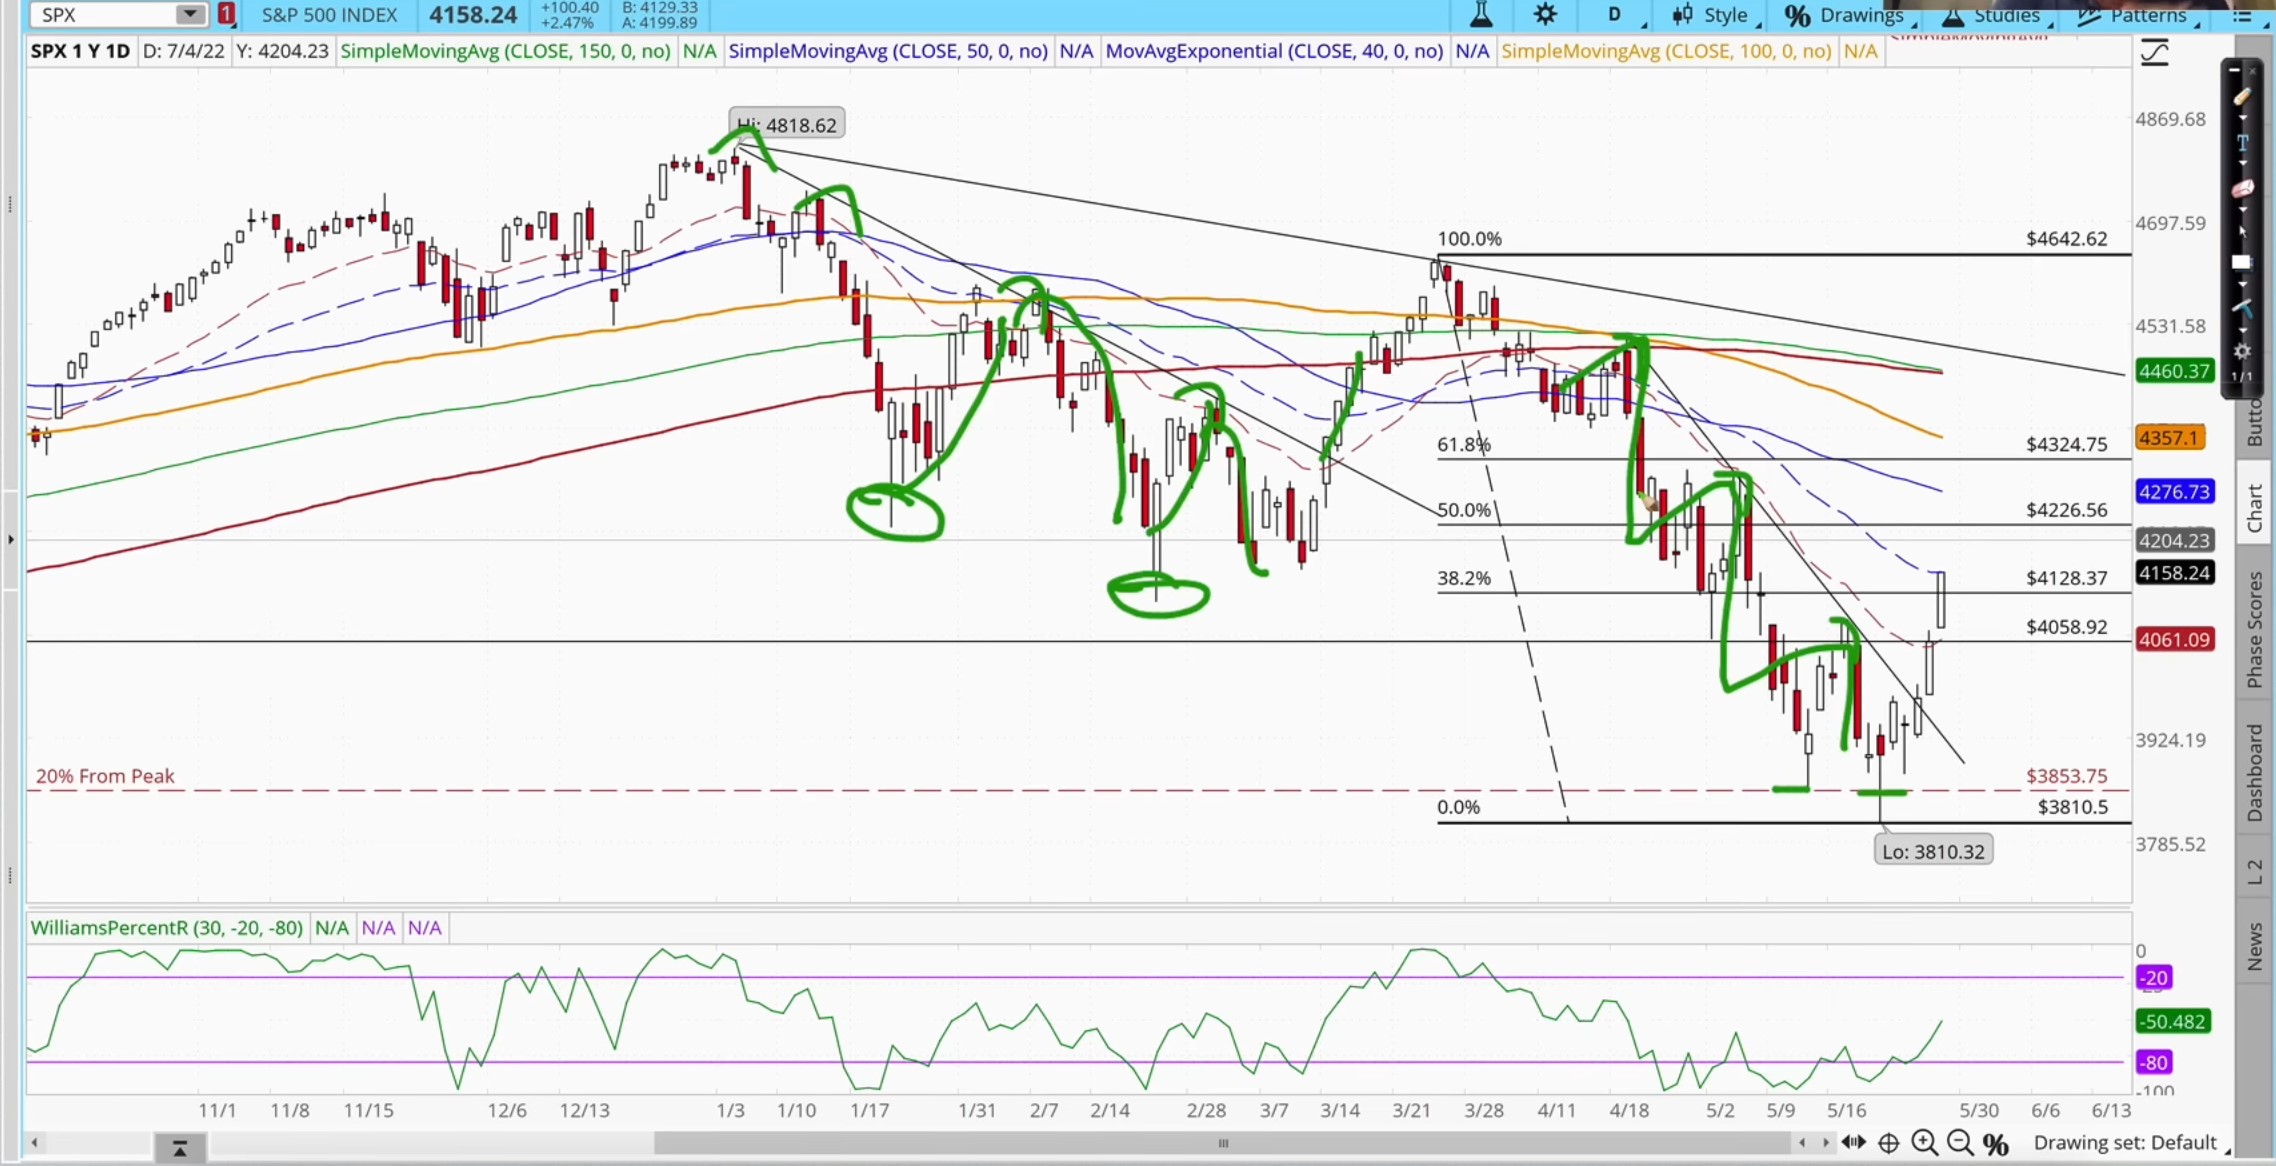
I'm using some technical patterns, so one of them would be Fibonacci Retracements. So again, you can see that the market moves in waves up, and waves down. Right now it's on a wave up, so where's this wave up gonna end?
🧠 Usually, it would reverse at a Fibonacci level.
It could be the 50% Fibonacci level or the 61.8% Fibonacci level, so I'm going to watch these two levels very carefully to see if the market would reverse at these levels. If it doesn't and it keeps going up, then great!
But if it reverses, I may put in some short hedges by going short on the market using OPTIONS where I'm still holding my long-term investments. In the long term they're gonna go up, but in the short term I may short the market with BEAR PUT SPREADS depending on the price action I see at these levels.
So I'm gonna watch this level at $4226 on the S&P 500 and $4324. Now if the market can break above these two levels then we're kind of like almost home free right, but wait. There is another significant resistance if I were to draw a line from the 2 highs, then it would be somewhere about $4477.
🧠 Again, if the market can break above this level, then we could have a very strong push all the way back to new all-time highs!
That's why I keep saying that as an investor, do I want to wait for a confirmed new uptrend or rather a confirmed all-time high to start buying stocks?
No, because by the time that happens, stocks are going to be expensive again and that's why I've already been buying.
I've already been buying stocks consistently in the last couple of weeks because I know that in the long run, good companies will always go up. So whether it goes up now or goes up next year, it's really immaterial to me.
As far as short-term trading is concerned, I could take some quick short-term trades but when it reaches this resistance level, I may want to take profit on my short-term swing trades.
Let's Look At The Facts
Now let me just say that, unlike many people who are already convinced we're in a bear market, that we're going to die, I'm not in that camp. So my base case is that I look at the facts — I don't just go blindly into believing something.
The facts say that we are NOT IN A BEAR MARKET — at least not yet — and this is not a bear market rally — at least not yet.
Definition Of A Bear Market
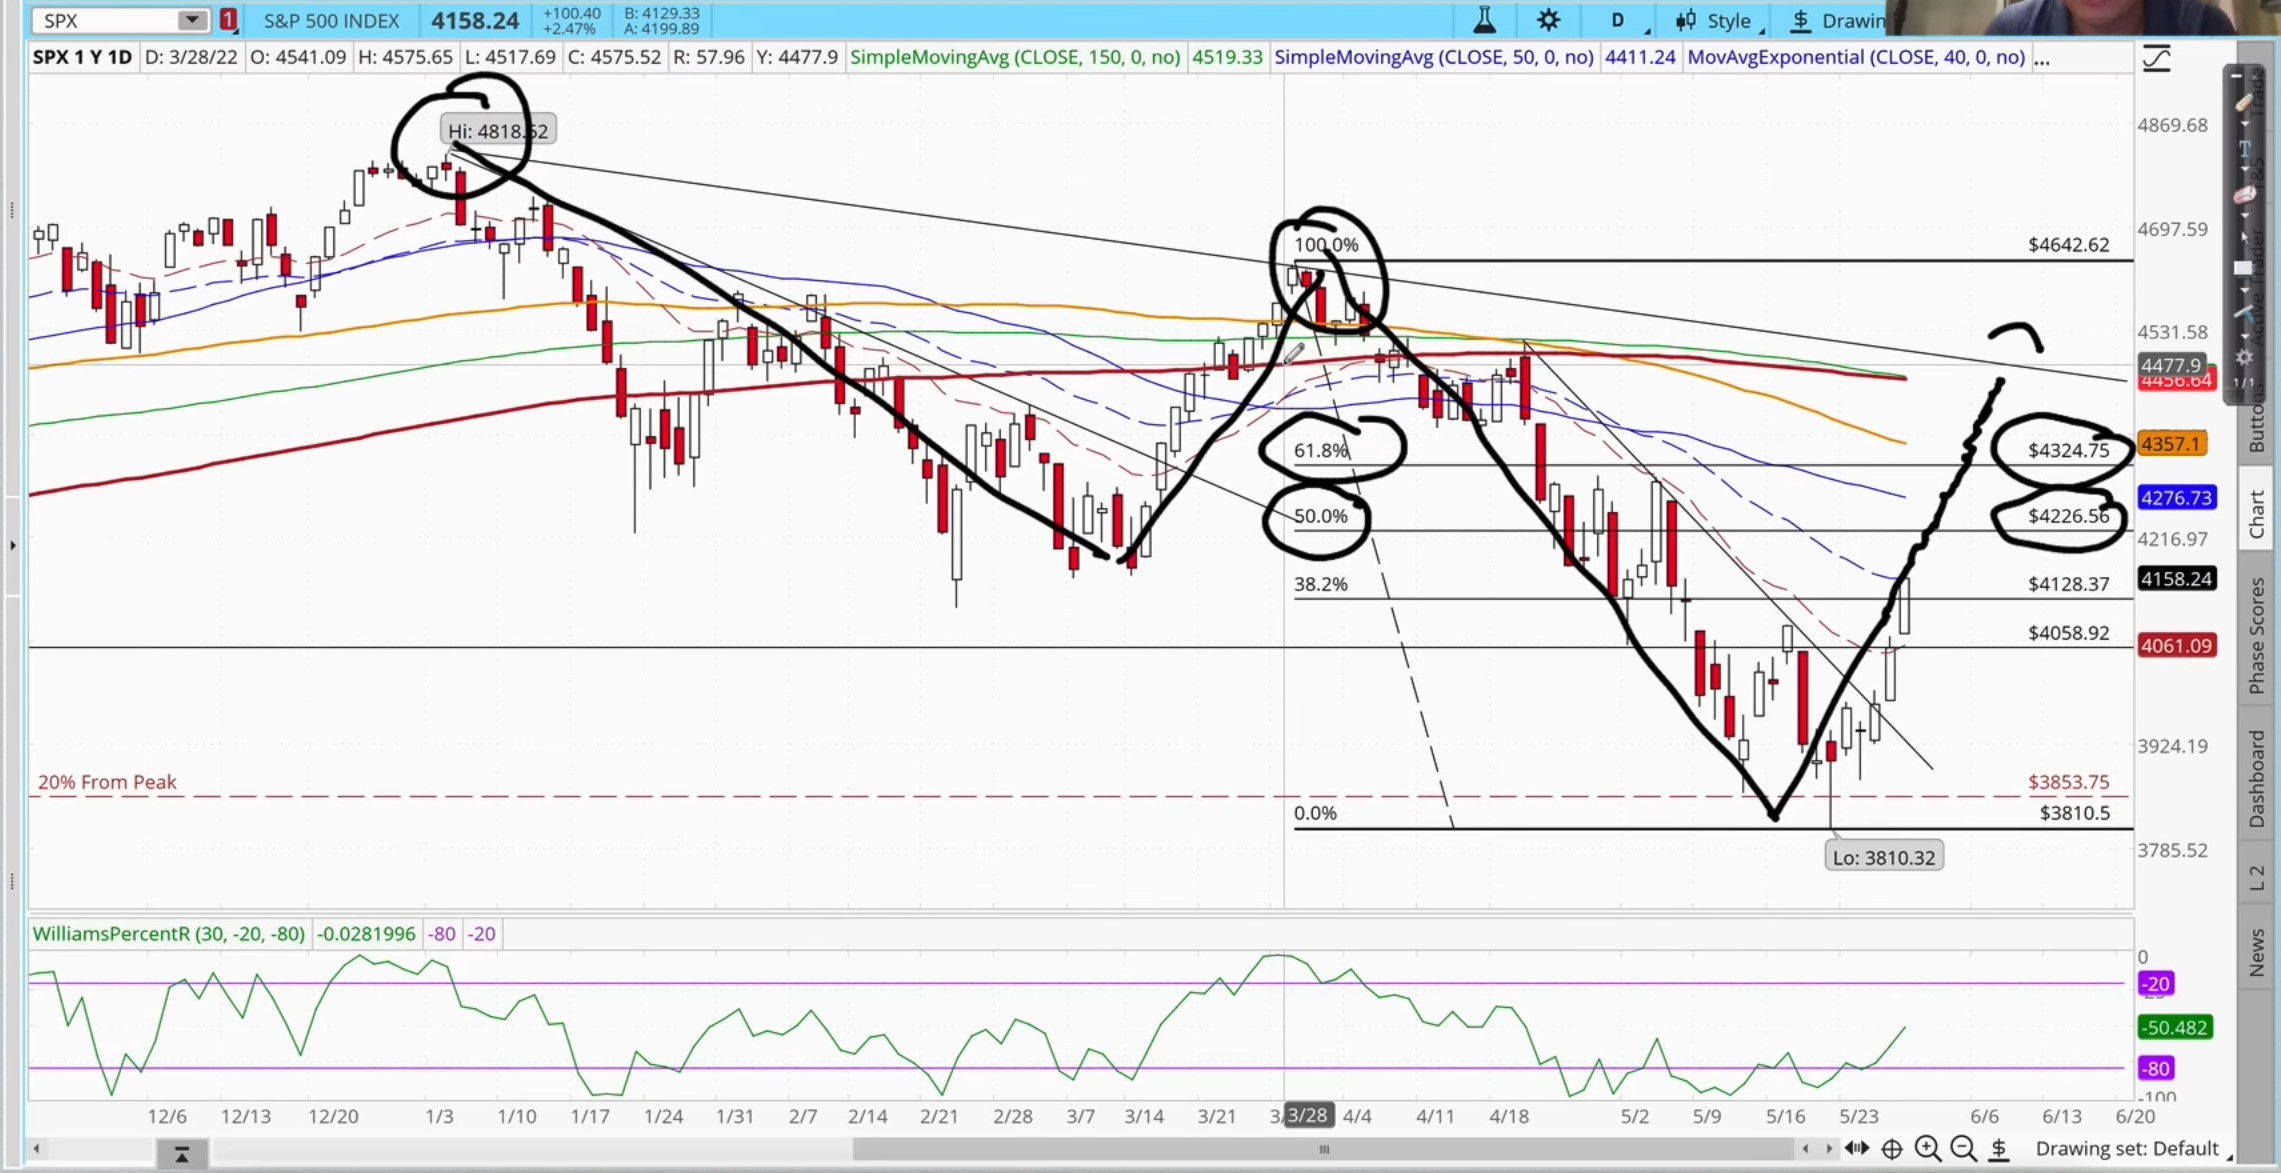
Remember that a bear market is defined as when the S%P 500 closes 20% below the high which is this level over here:
Did we close 20% below the high?
No, we did not. We flirted with that level because the S&P almost went to 20%, came back up then went below 20% flirted with the level, trapped the bears, but closed back up.
It NEVER CLOSED below 20%, so this ain't a bear market — at least not yet, right.
This is also not a bear market rally if it's not a bear market.
Now, what would cause the market to really go into a bear market? 🤔
Company Earnings Would Have To Decline
Well, what has to happen is that companies' earnings will have to decline.
A lot of people are saying that the market today is gonna be like the year 2000 DOT-COM crash or the 2008 financial crisis. You can't say that until the facts prove otherwise because remember that during those two bear market recessions, what happened to corporate earnings?
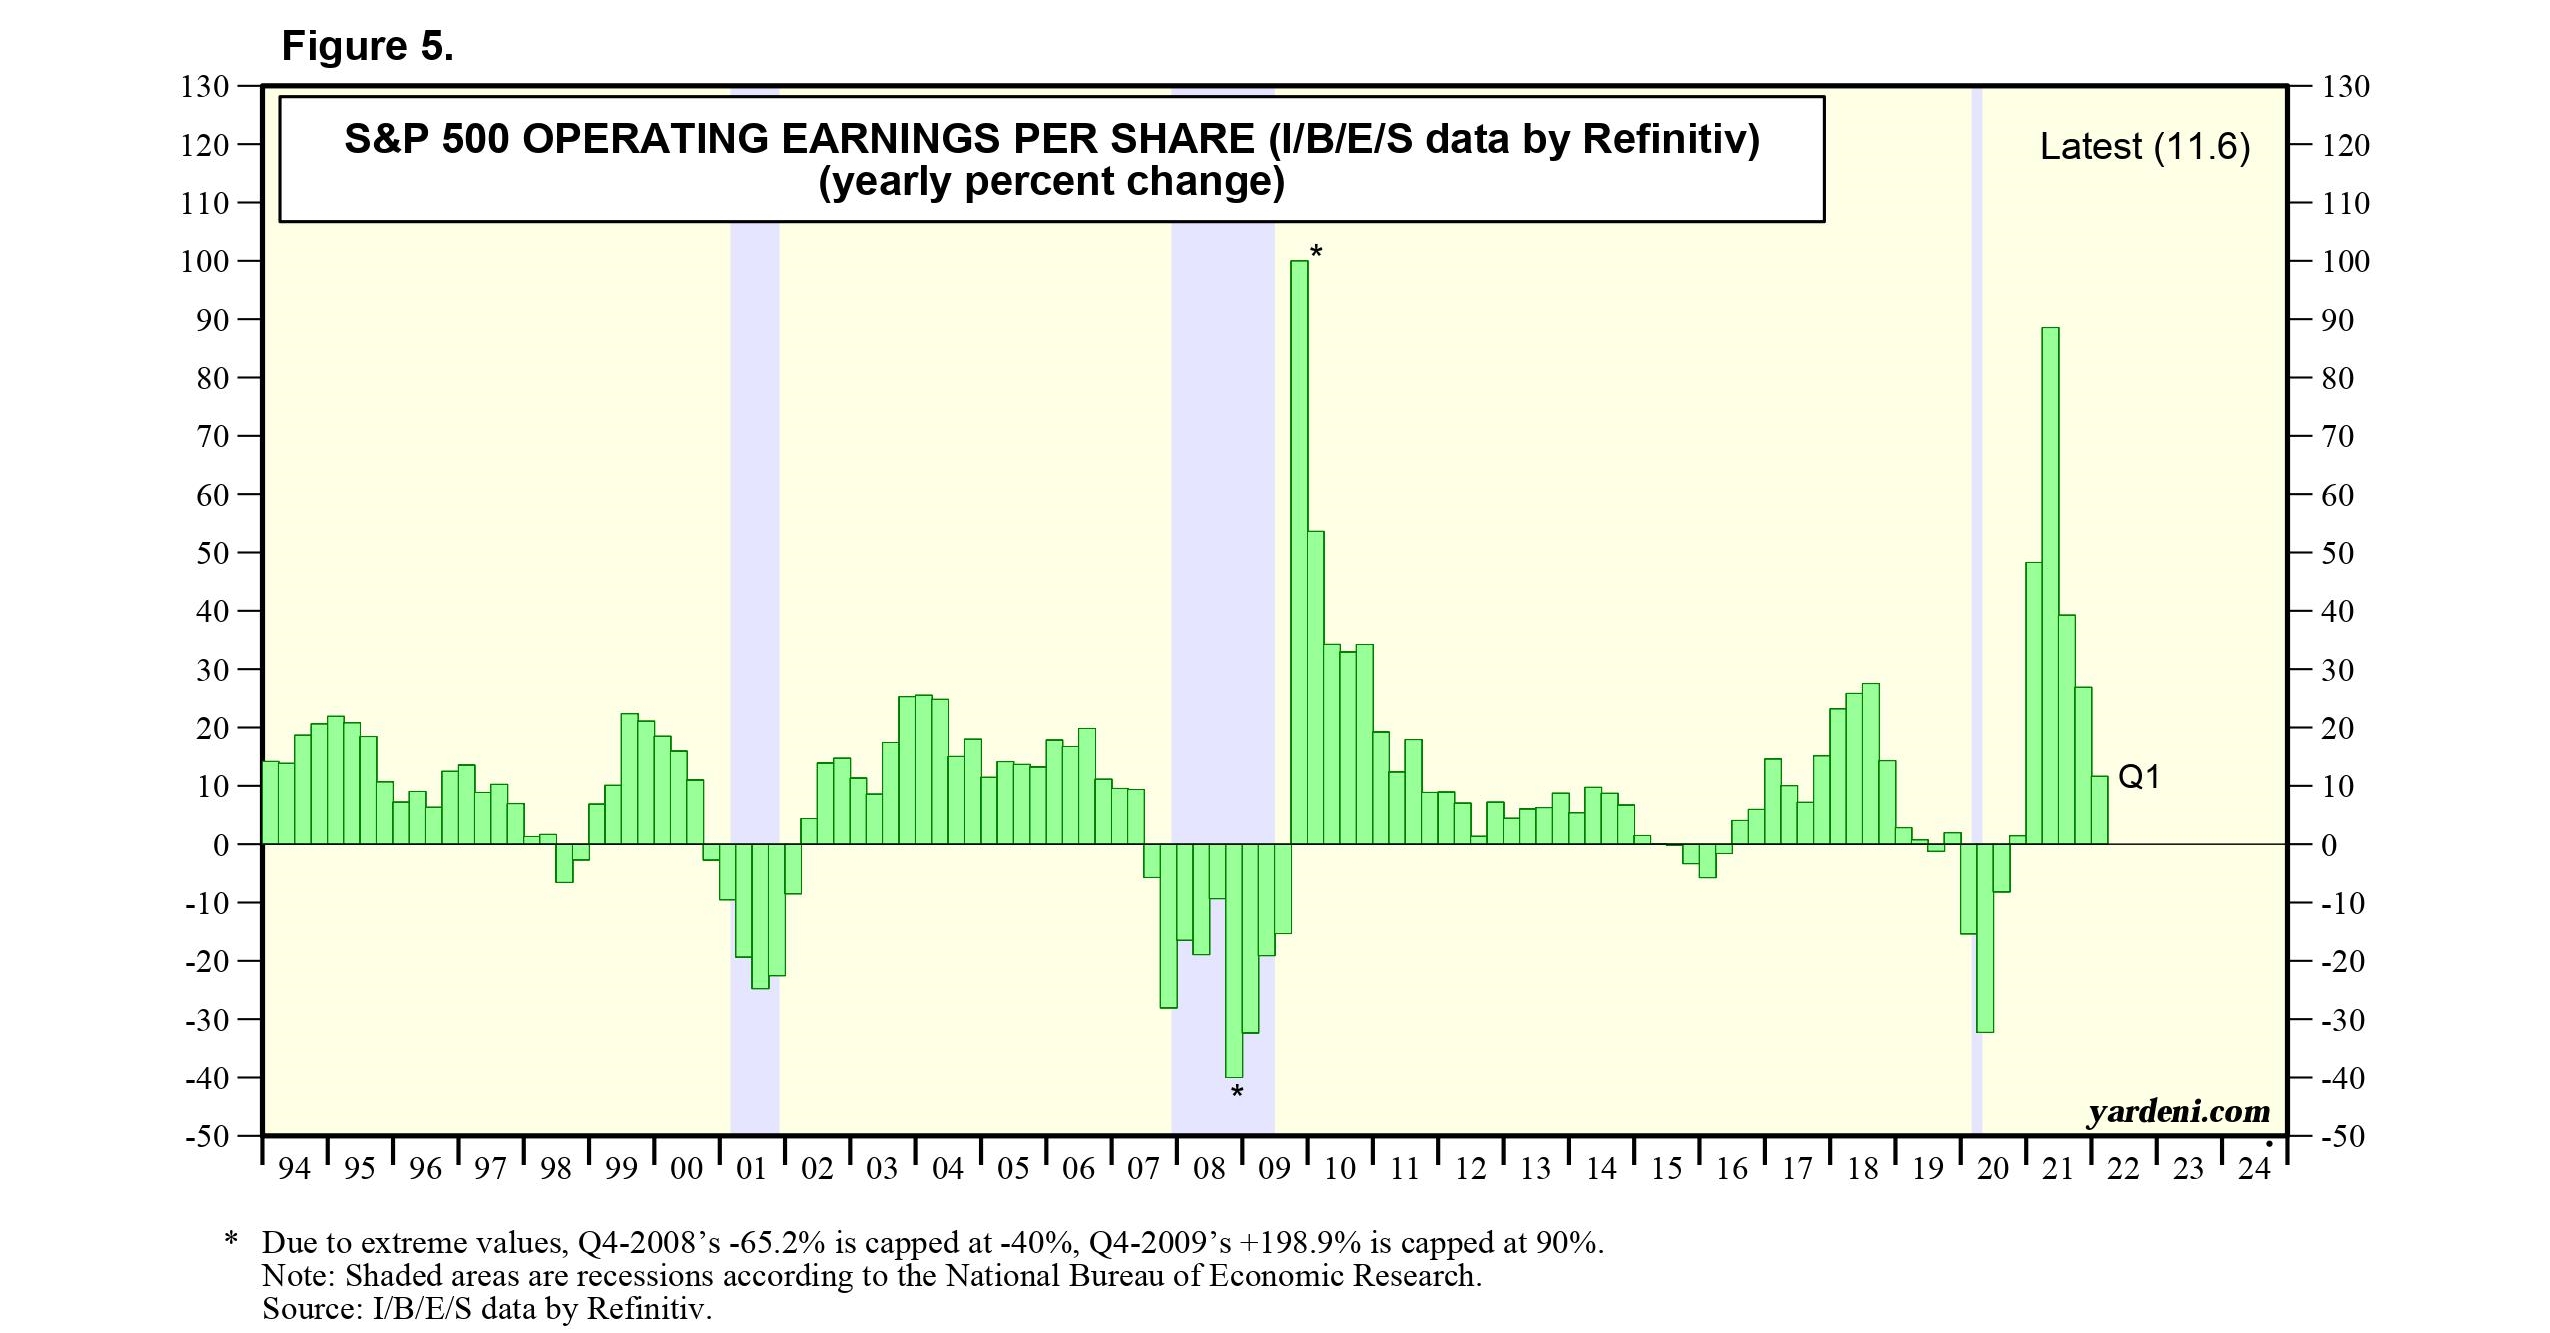
These are operating earnings per share. During those 2 bear market recessions, they went negative as you can see. Back in the DOT-COM crash, operating earnings went negative, the same thing with the financial crisis, operating earnings went negative. The same thing with the 2020 recession — earnings went negative.
So as of right now, are operating earnings negative?
Not yet. Could it? Maybe, but not yet.
So until it happens, we should not jump the gun. Currently, operating earnings of the S&P 500 are still positive, they are still growing although they are slowing down.
So is there a possibility that we could go into recession and hence company earnings start to go negative?
Well again, everything is possible, but for now, there's no data that proves that. Until there's data proves otherwise, we should not jump the gun.
GDP Is Still Projected to Grow
If you take a look at the latest estimates data from the Atlanta Federal Reserve, you can see the latest shows that GDP is still projected to grow in the 2nd quarter of this year.
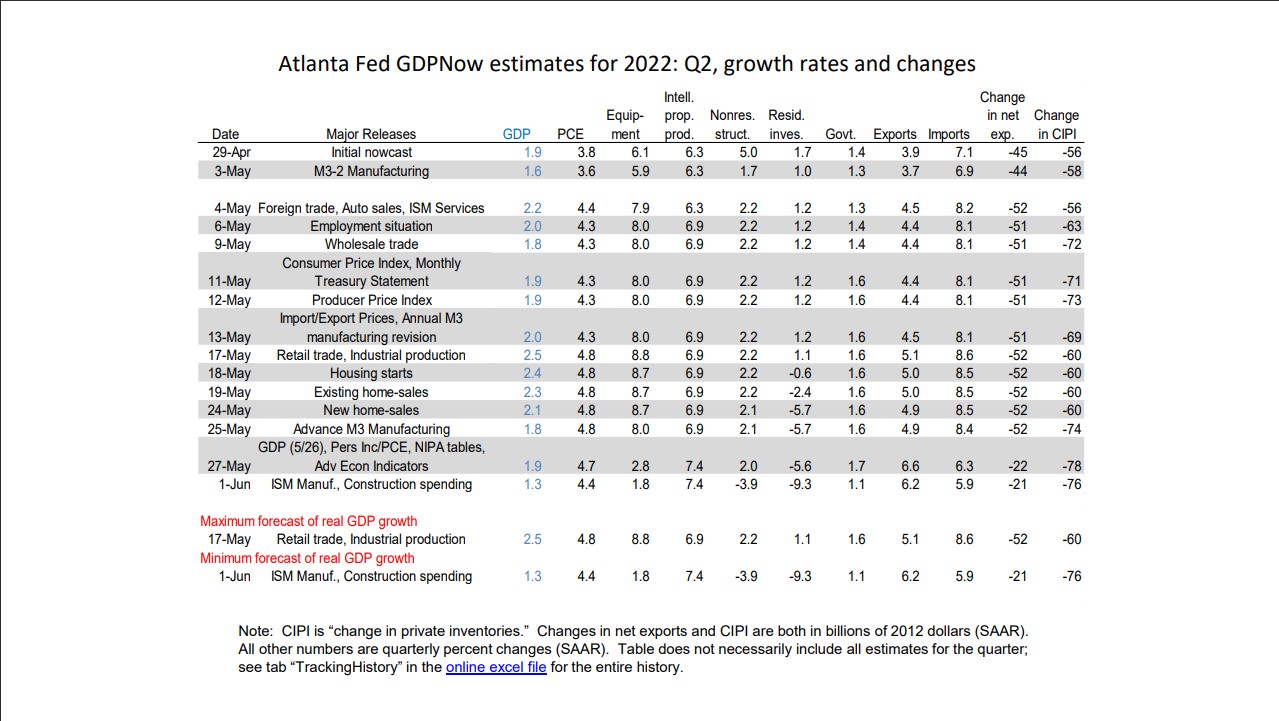
As you can see on 27 May, Advanced Economic Indicators show a 1.9% projected GDP growth based on all these variables like equipment, non-residential structures, residential investments, governments exports & imports, and so and so forth.
So for now, there's no bear market yet. It doesn't look like the financial crisis or Dot-Com crash, companies are still making money, and earnings are still growing.
Fundamental Shift In The Macro Picture
Now what's also interesting to note is that this strong rally in the market it's not only due to technical oversold factors, it's not just emotional.
There's actually a fundamental shift in the macro picture. What's been happening?
Inflation has actually been coming down. The 10-year yield has actually been coming down, and you'll find that for the first time, Bitcoin and Cryptocurrencies are not correlated with the market. So these are very powerful developments and show a shift in what's happening beneath the surface of the markets.
We Are Near The Inflation Peak
Now recall what I said a couple of days ago. In fact, I have said many many times that, based on the research done by Larry Williams, we are near the peak in inflation.
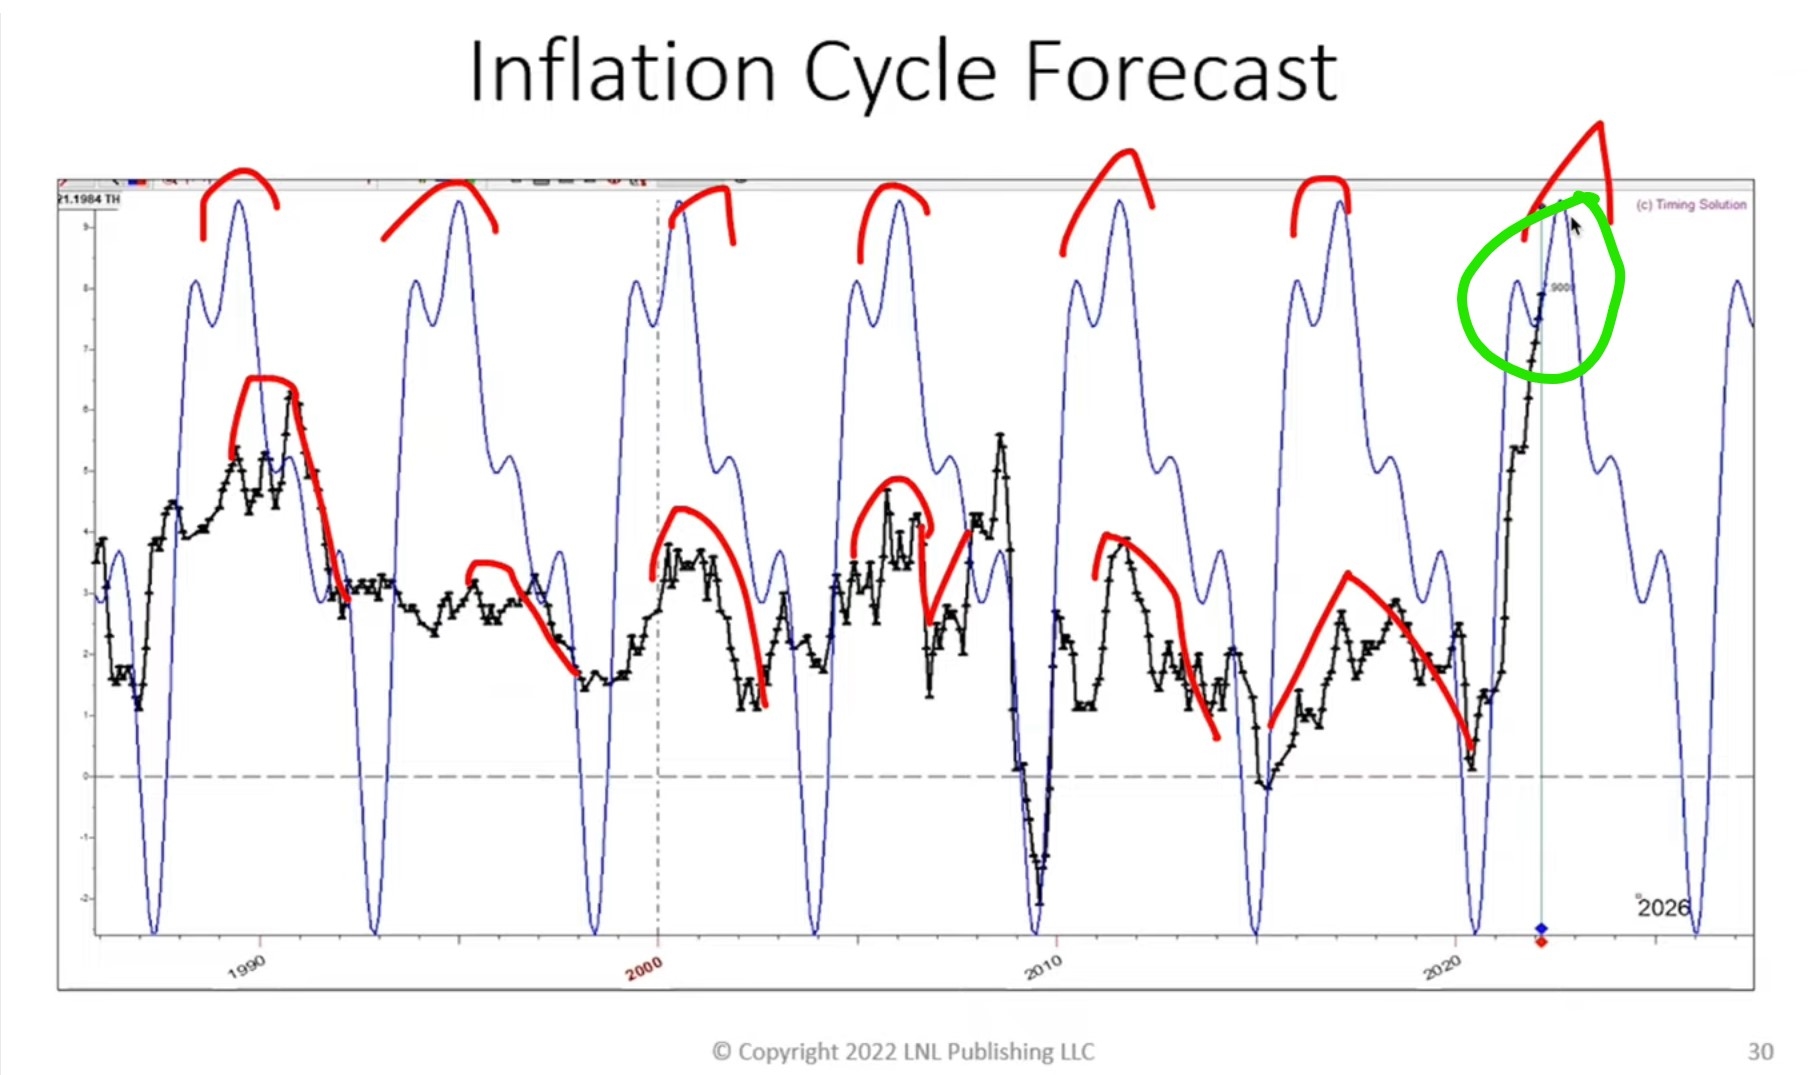
Based on the Inflation Cycle Forecast, we are coming to that peak which is somewhere in June, which is where we are at right now.
And the moment inflation peaks and comes down what tends to happen?
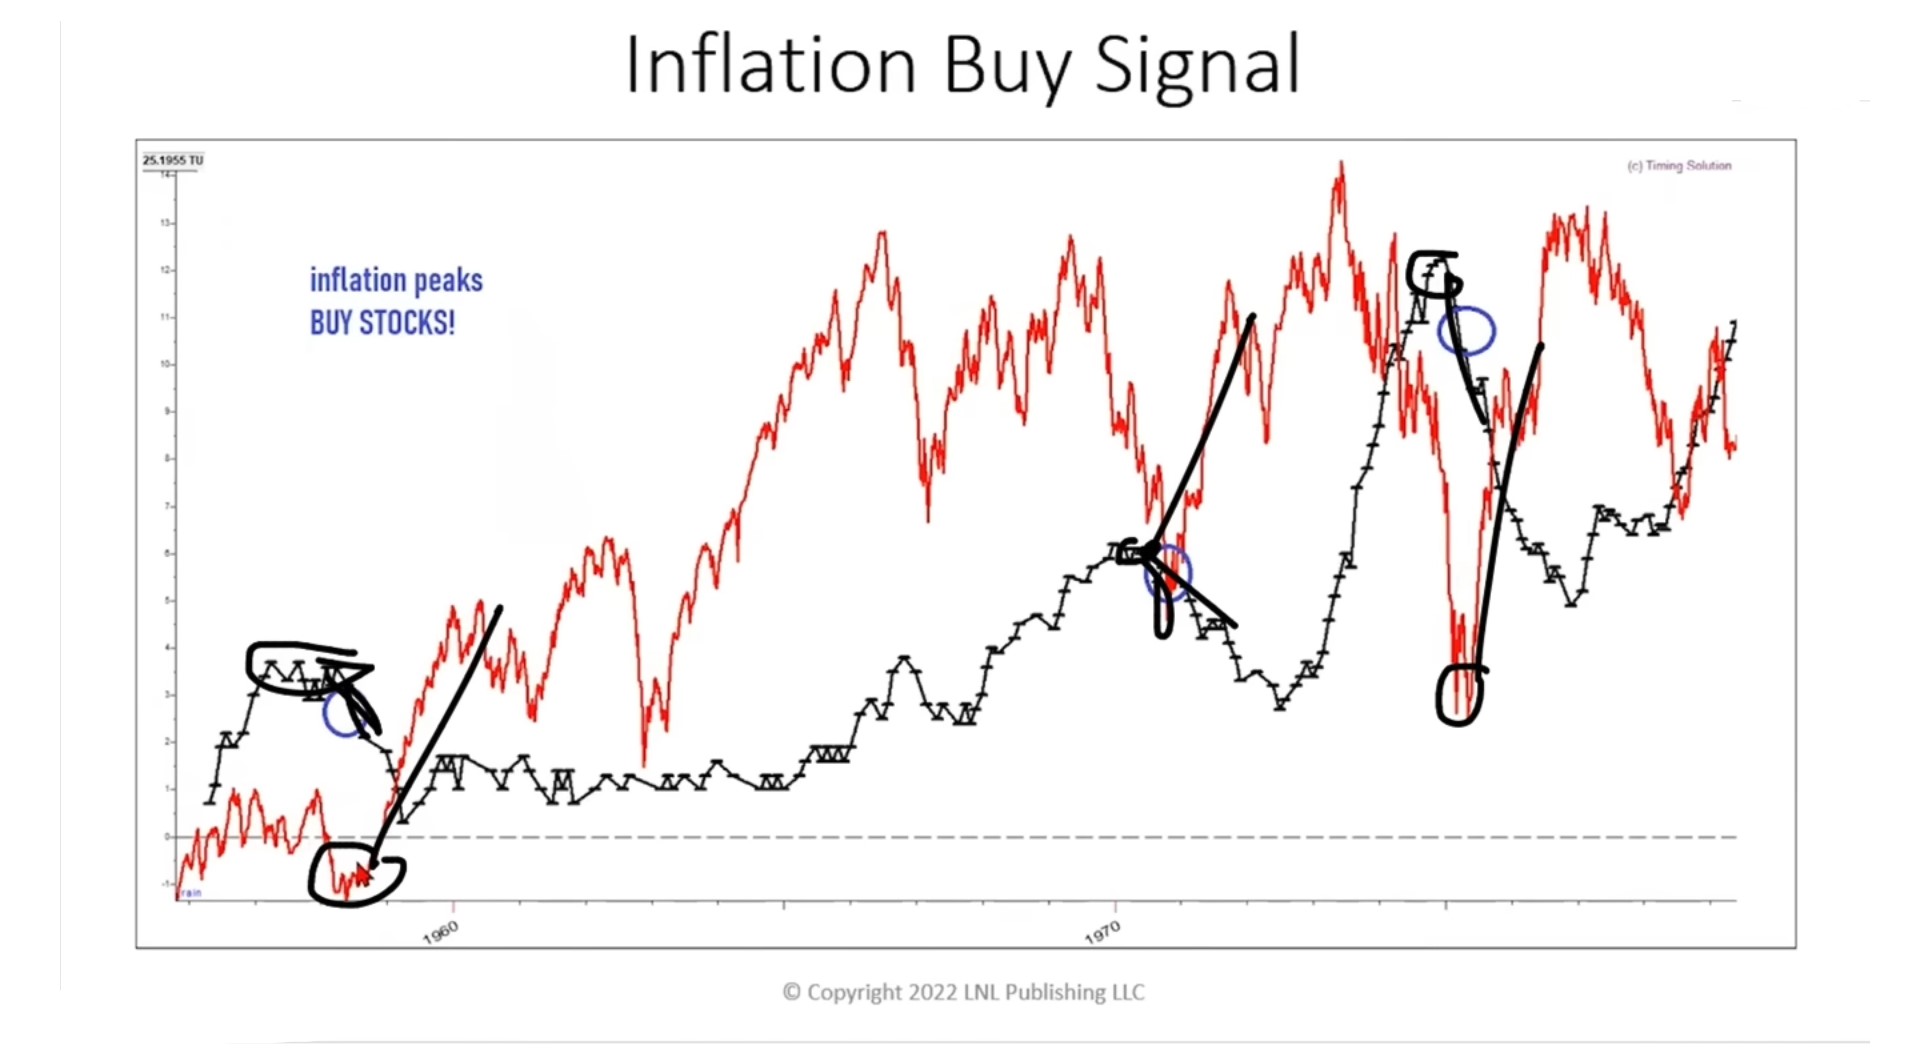
🧠 It tends to coincide with market bottoms.
I've shown you this before that every time the inflation (the black line) peaks and comes down, that's the market bottom.
🧠 So, inflation peaking and coming down is one of the best signals to enter the market.
So at this point in time, has inflation peaked?
It looks like it may have already peaked — again there are no guarantees it could go up again, who knows, but for now, it looks like inflation may have peaked.
Why?
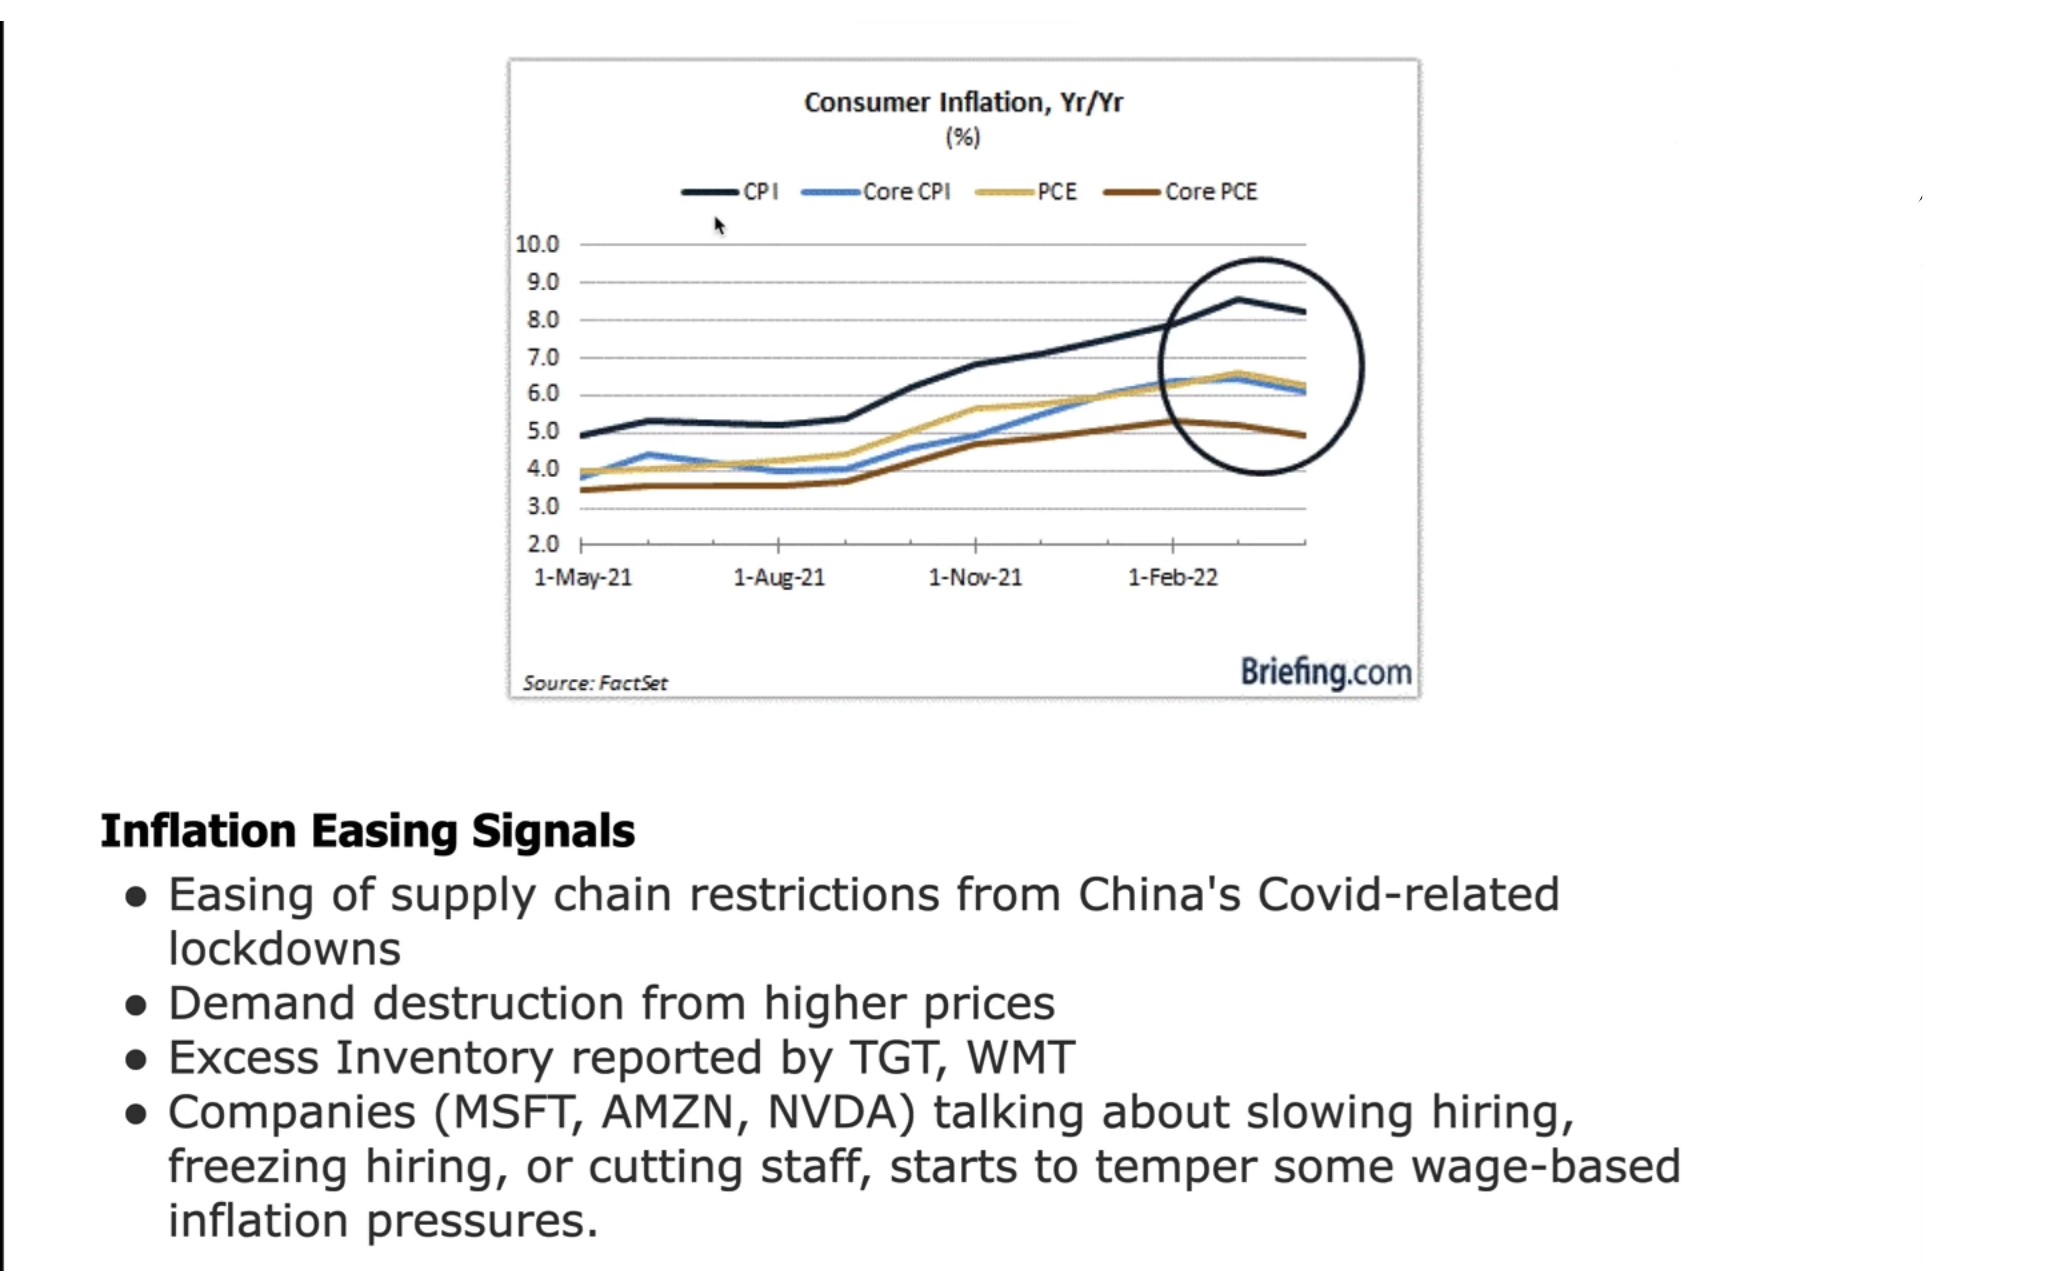
For the first time in several quarters, it looks like consumer inflation — measured by CPI, Core CPI, PCE, OR whatever measure, it shows that it's actually been abating. Inflation is coming down for the first time in many many quarters. So that's a very very bullish sign for the markets and that's why the markets rallied so strongly as well, not just because it was oversold.
So what has caused inflation to start coming down?
#1 has been the easing of supply chain restrictions from China as they start to find that they are getting Covid under control, they are reducing the lockdowns.
#2 would be the demand destruction from higher prices. So now with higher prices, higher gas prices, and higher property prices, people are starting to cut back on their spending, lowering their demand, and that is causing inflation to come down which is a good thing — which is what the FED wants anyway.
And for the first time, companies like Target and Walmart got whacked. They reported excess inventory. So when companies show that they've got excess inventory, that means that they couldn't sell as fast as they want. It shows that inflation could have peaked.
#3, we are also getting news from companies like Microsoft, Amazon, and Nvidia that for the first time they're slowing their hiring. In fact, they're freezing their hiring and even cutting staff. So that shows that this is gonna temper or bring down some of the wage-based inflation pressures. That's the rise in wages is coming down as the labor market gets less tight, and that's what the FED wants to see. Once we see inflation kind of like getting subdued, the 10-year yield comes down, then the market's going to RALLY really really strongly as well
#4, you can look at is what is known as the 5-year and 10-year break-even inflation rate. So what does it mean? The 10-year break-even inflation rate measures what the market thinks inflation will be in the next 10 years. It's the expectations of long-term inflation, and you can see that the blue line went all the way to 3% and since then it has actually come down to 2.6%. The five-year break-even inflation rate has also come down quite a bit.
So all signs are pointing that inflation is abating.
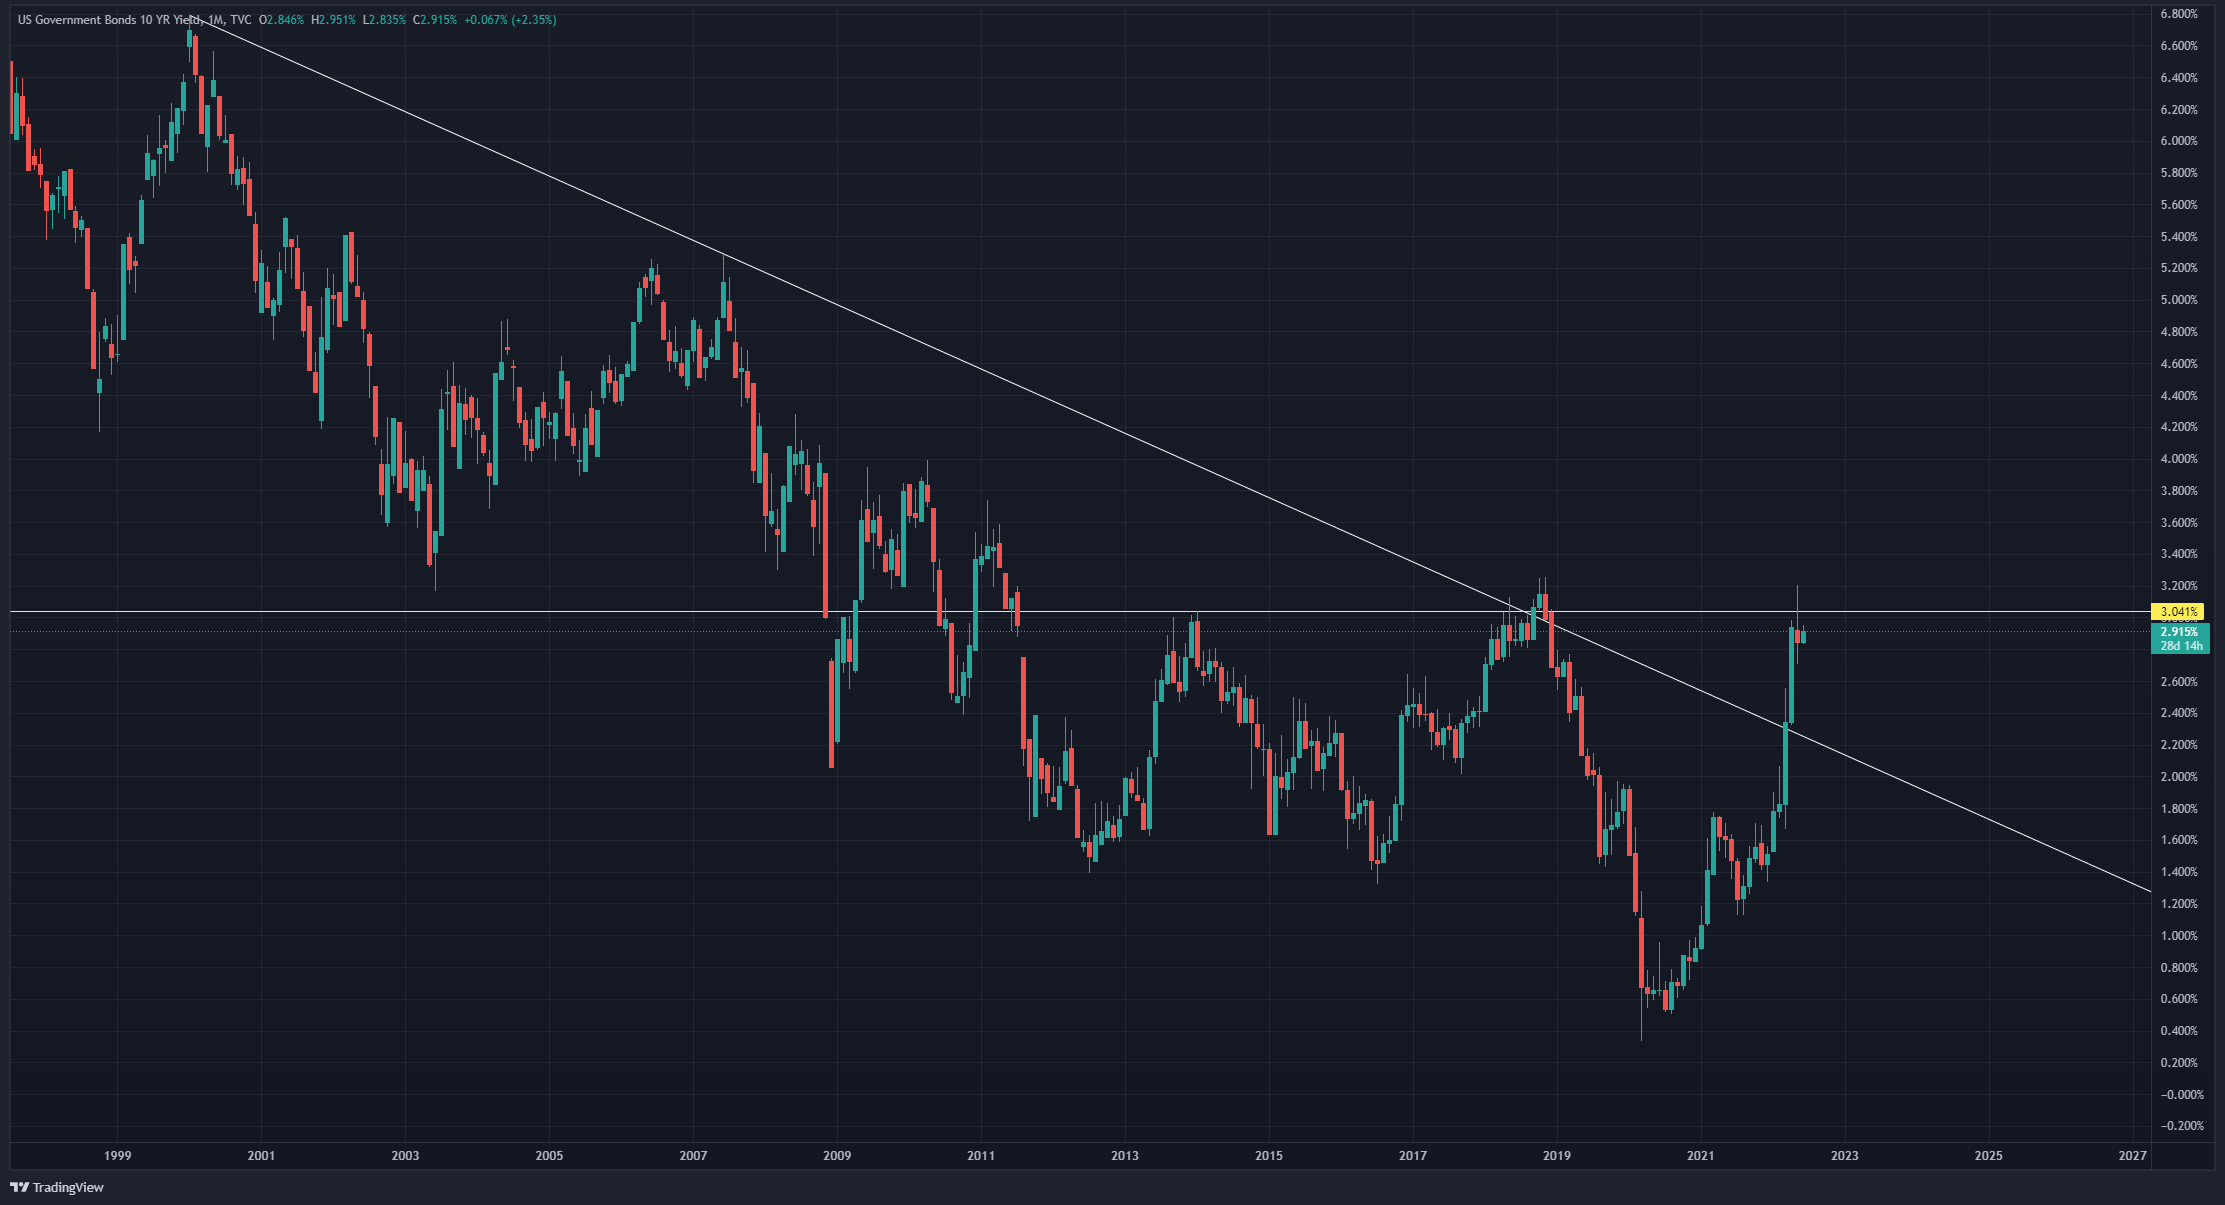
Now you can also see this in the 10-year treasury yield which I mentioned that it is at a very strong historical level of resistance, and for the first time we actually closed with a bearish monthly candle on the 10-year treasury yield chart.
So, there's a high chance the 10-year treasury yield has kind of like peaked and it may be coming down.
Remember that the 10-year treasury yield is kind of like a proxy for inflation.
When the 10-year yield goes up people, expect more inflation.
When the 10-year yield comes down, people expect inflation to come back down, which is very very bullish for the markets.
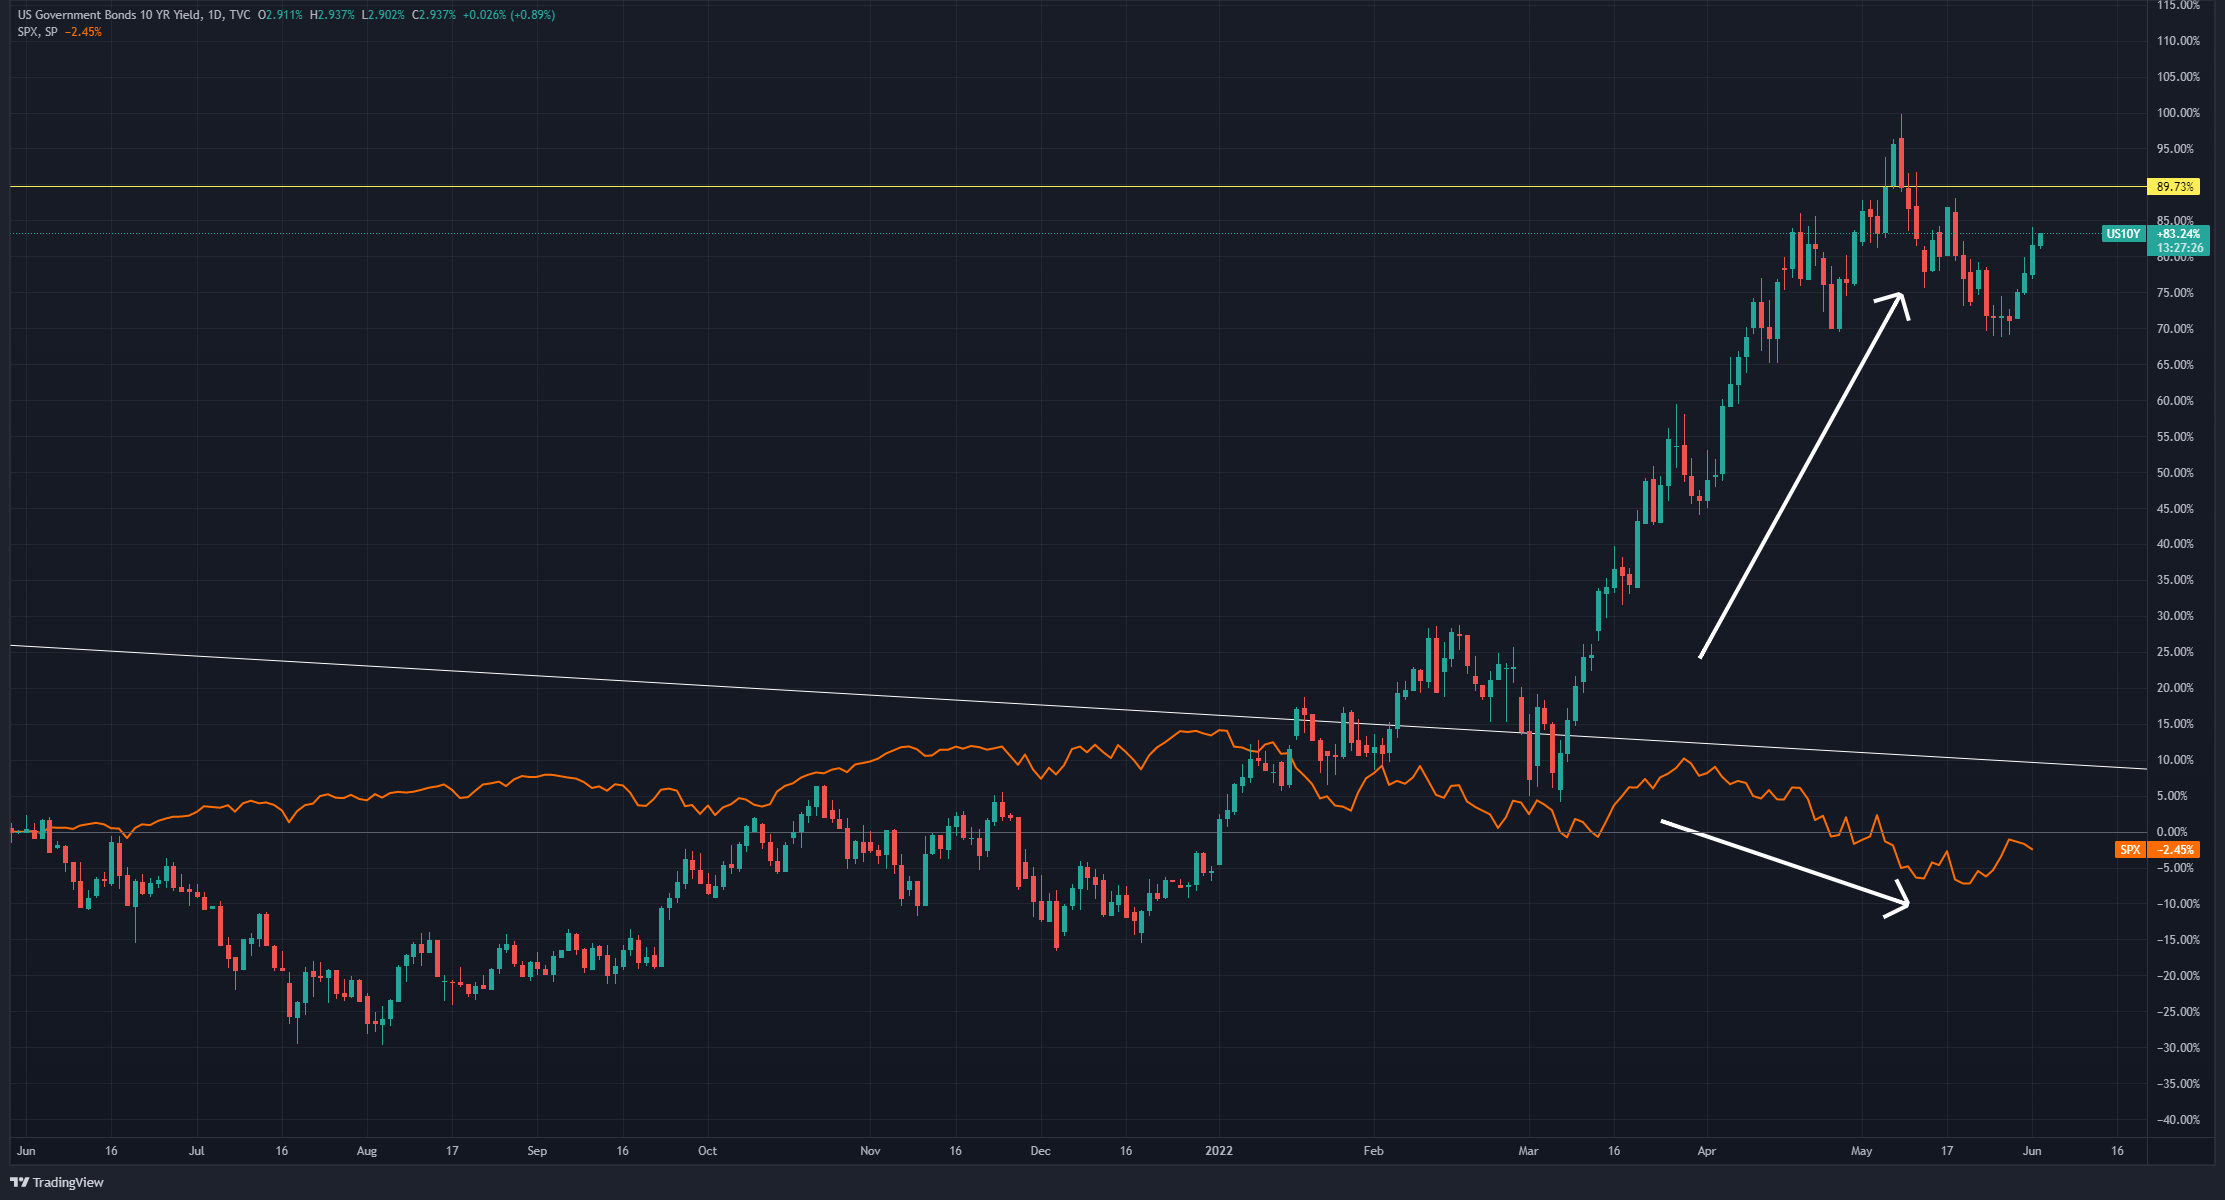
If you take a look at the daily candles on a daily time frame, looking at it with the S&P 500 chart, you can see how they correlate.
🧠 When the 10-year yield started spiking up, the S&P started selling off. So now it looks like as the 10-year yield begins to come back down — and hopefully stay down — the market will have a chance to rally back up again
So I'm gonna watch the 10-year yield very closely. I mean, of course, the 10-year yield can go up again, and that may pull the market back down again, anything could happen, so I'm watching this 10-year yield
Reasons To Be Bullish
The majority of people out there are giving all kinds of reasons to be bearish.
Maybe they're right, but I'm going to give you reasons why I'm bullish.
The first reason is that the S&P 500 is not yet in a bear market. It's still in a bull market, it's still just a correction in the bull market.
Now at the same time after this correction that we have had in the last five to six months, the market is no longer expensive. In fact, the market is now generally undervalued based on the price-earnings ratio of the S&P 500.
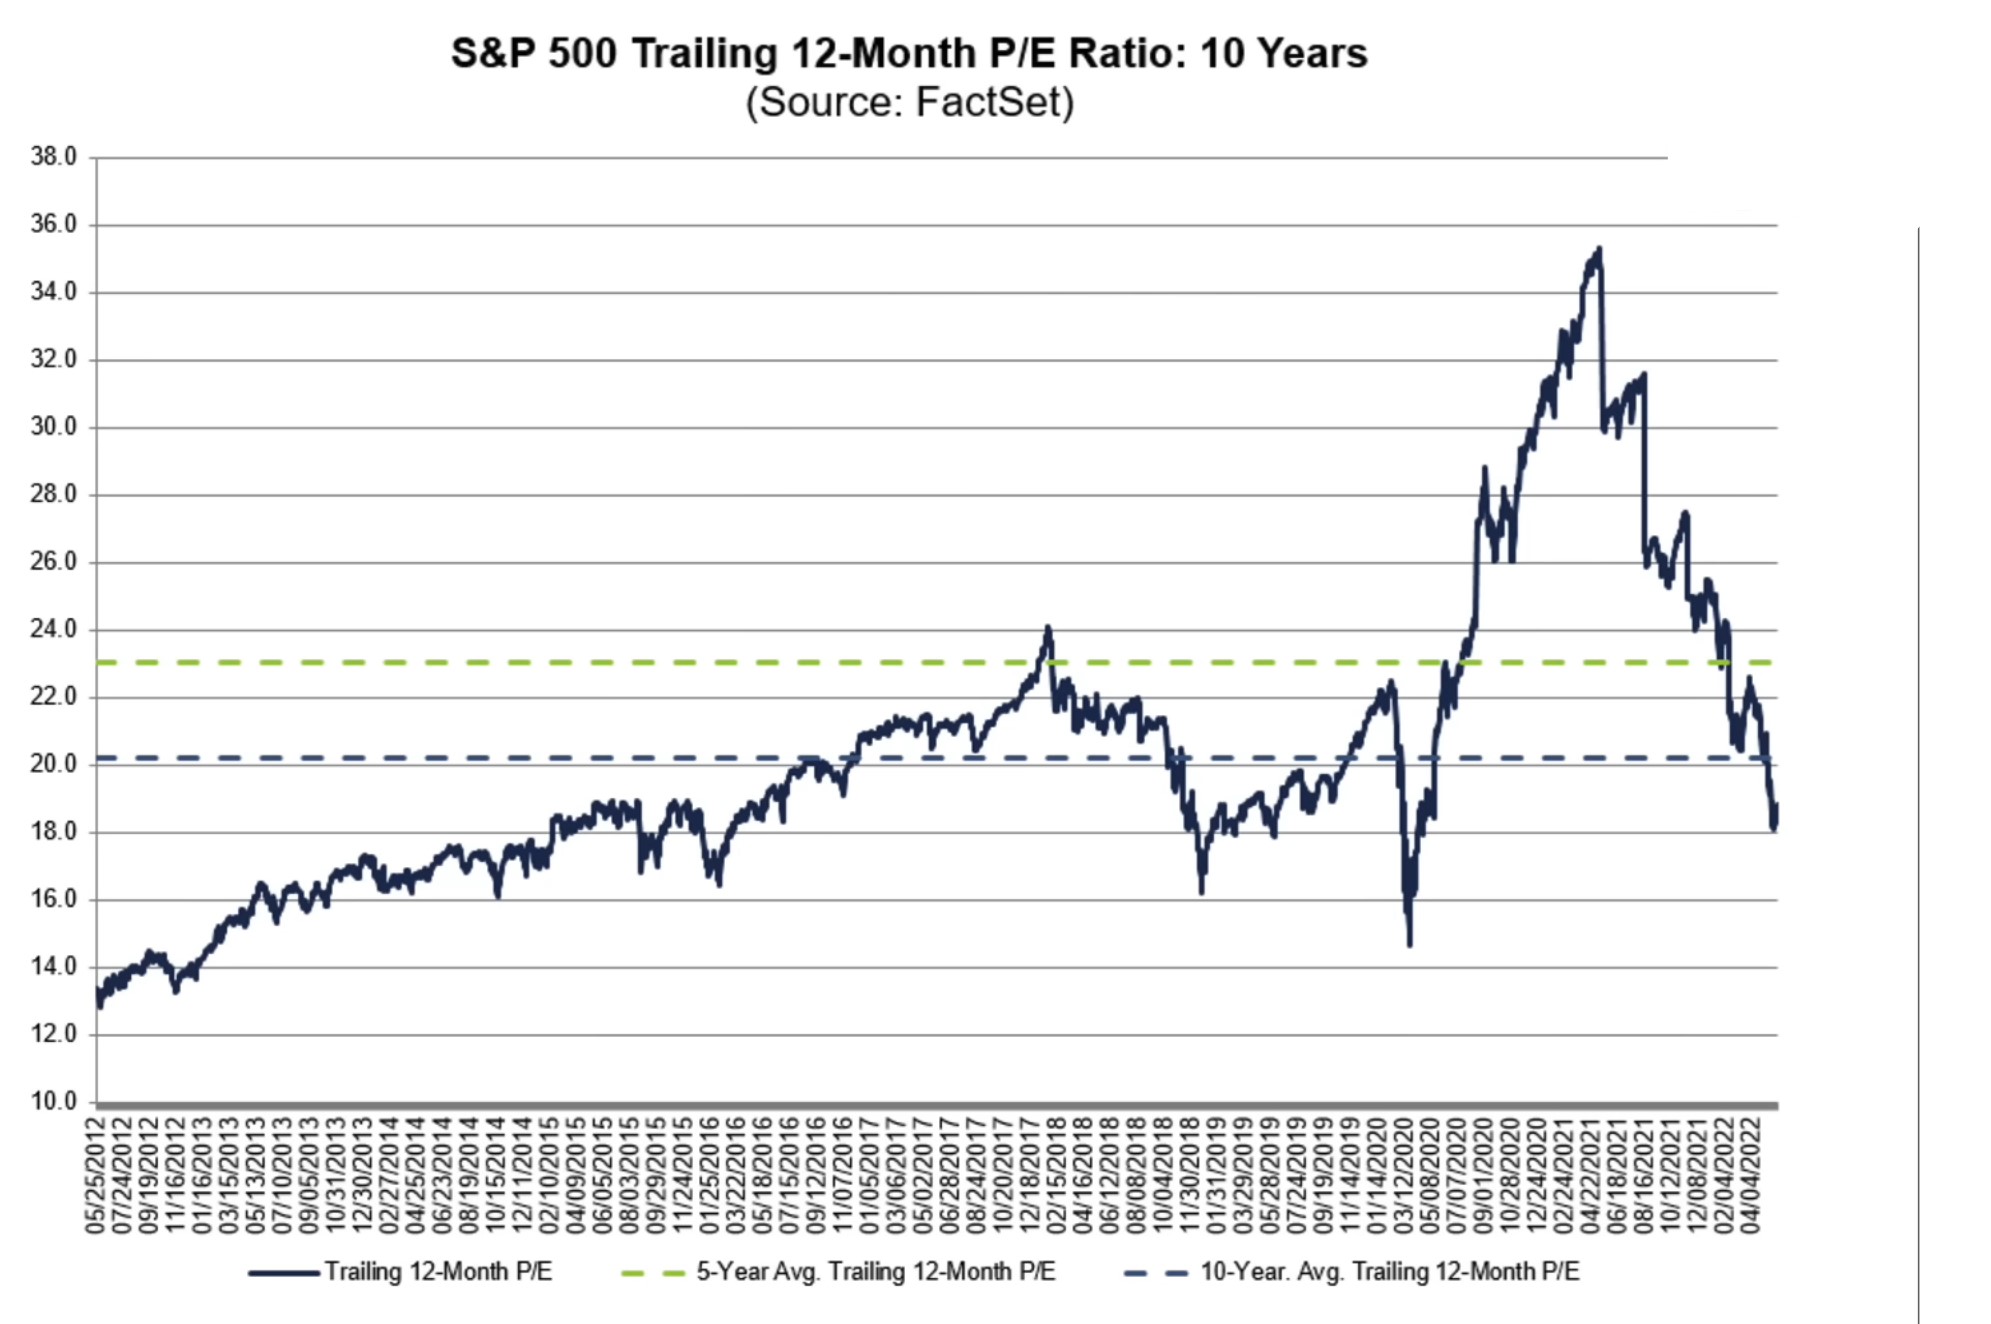
You can see above that the 10-year average P/E ratio is about 20 times earnings, and the 5-year average P/E ratio is about 23 times earnings. Currently, after the sell-off, we are at roughly about 18 times earnings.
So, we are actually undervalued on a P/E ratio basis. In other words, the market's not expensive anymore — the market is generally cheap, and you know that within the market, there are many good businesses that are really undervalued by 20%, 30%, or even 40%.
🧠 That's why I've been consistently buying shares in this market. So even if the market goes a bit lower, I don't really care. As long as you buy good companies that are undervalued, you have done your job. You don't have to predict exactly when the market's going to go up — It could go up this year or next year, it doesn't matter because, over time, you'll buy good companies cheap, you will make money.
It's impossible to lose money if you buy a portfolio of great companies.
An Investor's & Trader's Strategy
So based on this knowledge, what's the strategy for an investor?
So I'm going to talk about it from an investment perspective first, and then from a short-term swing trading perspective.
Firstly from an INVESTMENT perspective, is this a good time to buy shares of good companies?
The answer to me in my opinion is YES. In fact, I have already been buying shares consistently for the last couple of weeks.
Remember, as long as you buy shares of good businesses and you buy them when they're undervalued, you will make money over time. The companies will compound and grow in value, so the important thing is to ensure that you only buy companies that are profitable, that have got positive free cash flow, competitive & durable advantages, and conservative debt.
So if you are holding trash companies that are not making money, that are overpriced, that are speculative hype companies, then to me, if I'm holding those crap companies, I'll use any rally in the markets to get out of those stocks, take the money, and reallocate it to good companies.
Again, if you don't know how to identify or analyze if it's a good company, you've got to take the Value Momentum Investing™ Course because that's where we teach you how to only buy good companies.
🧠 So if you buy good companies at a discount, you can't lose money — it's impossible to lose money if you're patient. If you buy a portfolio of good companies, they will rise over time. And like I said, you don't have to buy at the exact bottom. As long as you buy when it's undervalued, you've done your job as an investor.
As I said, I've been buying in the last couple of weeks, and I'll continue to buy right now, stocks of great companies.
Now from a TRADING perspective, it is different.
In trading, it's a one-night stand. Just get in, get out, and have your stop loss & your profit target. You don't really have to care about valuations, you don't care about good companies, just trade based on the price action.
So from a trading perspective, I would say that one could take some short-term long trades cautiously because right now short-term, the market is bullish. So I expect the market to be bullish at least for the next couple of days.
So, you could take some quick swing trades, get in the market, and take profits quickly once it hits certain levels of resistance. Once those resistances are hit, if you see a reversal pattern, you could take some short trades as well by using OPTIONS Bear Put Spreads on the S&P ETF or the QQQ.
So that's it from a trading perspective, all right. I hope that helps and may the markets be with you. Let's see how the market unfolds for the rest of the year.
subscribe to our newsletter today!
Get first dibs on our latest investing & trading content every week FOR FREE!
*Your email address will not be forwarded to any third party. We respect your privacy.


submit your comment